TheDinarian
News • Business • Investing & Finance
? The Dinarian on Locals brings you the latest in news, interviews, in-depth conversations, and stories from across the blockchain and global communities—within and beyond cryptocurrency ?. Experts delve into how blockchain technology is reshaping industries, enhancing business networks ?, transforming transaction workflows, and advancing distributed ledger systems ??. We also explore intriguing topics that may venture into the realm of conspiracies—and so much more!
Interested? Want to learn more about the community?
Gold & The Upcoming Recession

We are now seeing the initial stages of a currency, credit, and banking crisis develop.

Driving it are an inflation of prices, contraction of bank credit and a pathological fear of recession.

One can imagine that the major central banks almost wish a mild recession upon us so that they can keep interest rates suppressed and bond yields low.

The key to understanding the course of events is that the cycle of bank credit is turning down, and this time the factors driving contraction are greater than anything we have experienced since the 1930s, and possibly in all modern monetary history.

This article joins the dots between inflation and recession and puts the relationship between money (that is only gold), currencies, credit, and commodity prices into their proper perspective.

The bank credit downturn…
It is increasingly obvious that the economic cost of sanctioning Russia is immense, and there’s now growing evidence of all major economies facing a downturn in economic activity. And we don’t have to rely on GDP forecasts to know why. Intuitively, if food and energy shortages impact us all, higher prices for these items alone will affect our spending on less important items and services.

That’s reasonable enough for sensible citizens. But financial analysts insist on quantifying it with their models. Their principal measure is the total value of all recorded transactions, comprised of GDP. They proceed seemingly unaware of the difference between the value of economic activity to the advancement of the human condition, which can’t be measured, and a meaningless total comprised of only currency and credit, which can. Consequently, all they end up recording is changes in the quantity of currency and credit deployed in the economy.

Of course, there is a broad point that if the quantity of currency and credit contracts, GDP falls. And if it is severe, economic activity tends to fall as well. But to equate the two to the point that a variation of less than a per cent or so from modelled forecasts means anything is nonsense. A proper assessment of the economic condition gets lost.

Instead, an awareness of the role of bank credit is called for. Banks create credit, which feeds into the GDP total when they are optimistic about the outlook for lending. And when they deem the outlook to be deteriorating, they withdraw credit which reduces the GDP total. It leads to a repetitive cycle of boom and bust. We are now entering a period where, at the margin, banks are trying to reduce their exposure to credit going sour. Therefore, GDP will contract And we can assess where it will contract. It really is that simple.

The best thing to do is to stand back and let the excesses of lending and the support for malinvestments wash themselves out of the system. The last time this was done was the brief but very sharp recession of 1920—1921 in the US. The government of the day understood it was not its business to intervene, and anyway, it was not capable of improving thngs.

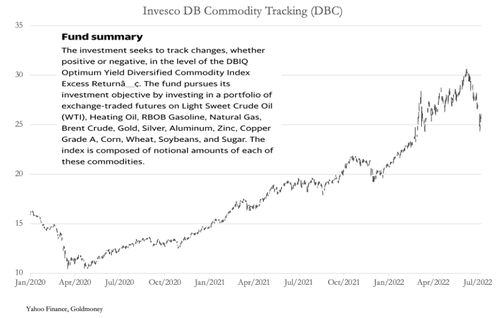
But increasingly since, monetary policy has become run by central banks which steer their economies through rear view mirrors, reacting to information rather than anticipating. But even if they could anticipate economic trends they lack the commercial nous to manage it. Instead, their stock reaction to declining GDP will be to “stimulate”. Not only do they have a mandate to maintain full employment, but they have a Keynesian belief that a decline in GDP is entirely due to falling demand. Falling demand, they say, leads to lower prices, so the inflation figures in the CPI will fall. Producer prices will fall. All commodity prices will fall. The chart below feeds this line of hopeful thinking.

This basket of commodities has fallen in value by 17% in a month. Panic over. Even wheat and soya prices have fallen. Dr Copper is down. Grasping at these straws, central banks are undoubtedly relieved that inflation might be turning transient after all.

Or so they think. There is no doubt that we are experiencing enormous price volatility. If it was entirely due to consumers deciding not to spend because prices are too high for them, that is one thing. But if it is because banks are withdrawing credit, the consequences are materially different.

A central bank’s concern to maintain consumer spending might discourage banks from contracting credit for consumers, at least initially. Furthermore, their risk models show that while individually consumers using credit are often high risk the magic of securitisation turns these risks collectively into low risk. It becomes a numbers game. So, credit card and other consumer faced lending divisions with very high credit margins are not the first to be targeted. And anyway, that would put the bank’s executives at odds with the central bank.

Instead, in the initial stages of a credit downturn, banks withdraw credit principally from business borrowers who use overdraft facilities. A business that frequently resorts to overdraft facilities is high risk in any bank’s assessment. Weaker businesses are first to succumb to the credit downturn for this reason. Other early victims of credit contraction are financial speculators because their collateral is easily realised. We have seen the decline of US stock indices so far being accompanied by a $200bn reduction in margin lending. There’s still much more to go.

As the economist Irving Fisher pointed out in the 1930s, calling in loans to reduce bank credit can become a self-feeding destruction of value. The bit he failed to understand is that in a serious downturn it can’t be helped, because it is the other side of earlier credit expansion, and it is the unwinding of unsound lending. Both an understanding of what drives periodic contractions of bank credit and the empirical evidence that it has repeated in one form or another approximately every decade since records began, inform us that it should not be stopped but allowed to proceed. Compare the brief 1920—1921 slump in the US with the prolonged 1930s slump, the latter managed by first Presidents Herbert Hoover and then Franklin Roosevelt.

We should also know from understanding that bank credit is a cycle, that the height of the recent expansionary phase measured by the ratio of total bank balance sheet assets to their shareholders’ capital indicates the likely severity of the subsequent credit contraction. It reflects deposit liabilities to a bank’s customers relative to its shareholders assets. Traditionally, asset to equity ratios of more than eight to ten times were deemed risky. Some major banks, particularly in the EU and Japan, are now at over twenty times. While the US banks are less geared, the systemic risks to them from other national banking systems in this financially interconnected world are the highest they have ever been.

For the immediate future we can discern two things. First is that production of goods and services is likely to be more limited than consumption due to an absence of bank credit, knocking on the head the Keynesian misconception that it is a problem of insufficient demand. That is just an initial phase. And following it, the contraction of bank credit can be expected to become more severe, as banks draw their horns in to protect their shareholders from an Irving Fisher style slump. In this subsequent second phase both producers and consumers will face enormous financial difficulties.

Without aggressive intervention by central banks, the correction from excessive over-lending taking bank balance sheets beyond dangerous levels of leverage will simply fuel a GDP slump. Central banks will intervene, not just to deliver on the full employment mandate, but to finance government budget deficits which will soar under these developing circumstances.

Prices in a slump
The last real slump, when the forces driving bank credit contraction were arguably less severe, was in the 1930s following the Wall Street crash. At that time, the dollar and sterling, together the world’s major international currencies, were both on gold standards. Prices of commodities, raw materials and agricultural products collapsed, effectively measured in gold through these two currencies. The political strains led to Britain abandoning its bullion standard in 1932, and the US gold coin standard was suspended for US citizens in 1933, followed by a 40% dollar-devaluation in January 1934.

The effect of the collapse of bank credit was to make circulating media in dollars and sterling scarce, thereby raising their purchasing power. To this extent, gold’s purchasing power also rose, because it was tied to the currencies. While gold gave credibility to the dollar and sterling, it was the contraction of bank credit that drove the slump in prices, while gold got the blame.

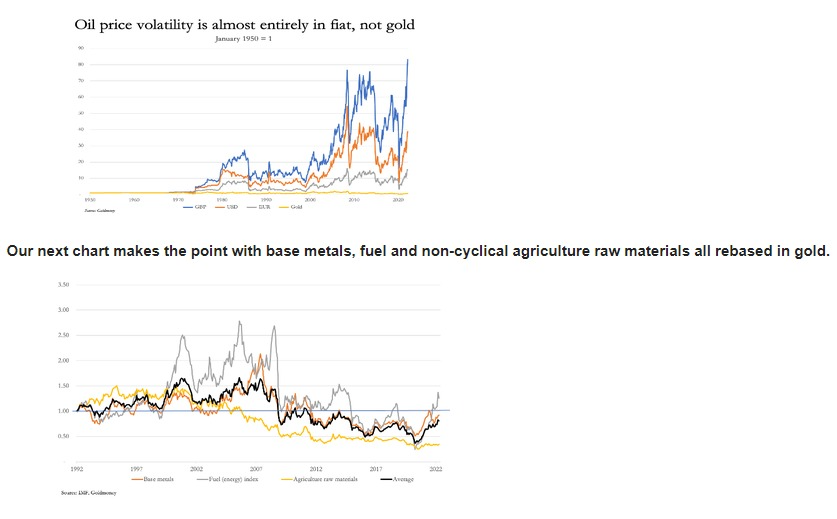
We know that priced in gold, over time commodity, raw materials, and agricultural product prices are remarkably stable. Disruption in the price relationship does not come from gold. The following chart of the WTI oil price rebased to 1950 illustrates prices in sterling, dollars, and euros where there are huge variations in prices. Contrast that with gold (the yellow line), where the price today is down about 30% from 1950 with minimal volatility along the way.

Since 1992, which is the earliest common date we have for these series, an unweighted average gold value for them has fallen a net 19% (the black line). Fuel has been the most volatile at up to 2.5 times the 1992 price, but from the previous chart we can see that it was up a net 12 times in US dollars in 2007/08 from 1992. Priced in gold, the relatively little volatility we see in these commodity groups is as close as we can get to free market values in sound money. And even then, we know that gold prices are manipulated in the markets. We can also assume that the origin of this volatility does not come from gold, but from the violent price changes in fiat currencies, their interest rates, and their distortions with respect to demand for commodities.

These findings overturn conventional opinions on price formation. The evidence is that it is not true that fiat currencies are purely objective in their relationship with commodity prices. Forecasters of commodity prices incorrectly assume there is no change from the currency side. But clearly, the fluctuations overwhelmingly emanate from the currencies themselves.

This brings us to the likely effect of an economic slump on prices. Initially in our analysis, we will assume there is little change in the public’s desire to hold fiat currencies relative to the range of commodities and consumer goods. That being the case, we can see that it will be variations in the quantity of currency and credit in circulation driving prices. A contraction in this quantity will tend to lower prices. And Keynesian economists might conclude that precious metals being commodities will also fall in price against fiat currencies, given that fiat currencies are no longer tied to gold.

The flaw in this argument is that there are indeed other factors involved, and the consequences for the quantity of currency and credit in a slump must be taken into account. Irrespective of changes in monetary policy, in socialised economies government budget deficits soar and will need financing by expansion of the currency if bank credit is not forthcoming. In other words, despite the tendency for banks to contract bank credit to the private sector and even if central banks do not amend monetary policies, it will be more than offset by an expansion of currency passed into the economy through the government’s books.

Furthermore, under these circumstances monetary policy will change as well. Following the initial withdrawal of overdraft credit from businesses and bank loans for financial speculation, there is likely to be a softening of consumer demand as lending standards tighten and financial insecurity for consumers escalates. Central banks will notice the tendency for the withdrawal of bank credit to lead to a slump in consumer demand. They will almost certainly reduce interest rates and reintroduce quantitative easing to replace contracting bank credit to stimulate flagging economic activity. They have eased and stimulated in every bank credit cycle at this point since the 1930s, and there’s no reason to think they will do otherwise today.

An increase in currency and credit, not emanating from the commercial banks but from the central bank, with increasing budget deficits will continue to debase the currency in gold terms. The currency will also be debased against commodities. But with some volatility imparted from the currency side, we can see that the general relationship between commodities and gold can be expected to remain intact.

A systemic failure is on the cards
All this assumes that within the context of the bank credit cycle there is not a significant systemic failure. Given that the forces behind credit contraction today are greater than any time since the 1930s, and possibly for all modern monetary history, that is a vain hope. Last week I pointed out the looming catastrophe for the euro system and the euro. A similar tale can be told about the Japanese yen. And sterling is just a poor man’s version of the dollar without its hegemony status.

In the event of a systemic crisis, the role of central banks will be to underwrite their entire commercial banking system. The consequences of letting Lehman go bankrupt on the last cycle of bank credit contraction did not serve as a warning to profligate bankers. Instead, it had us all staring into a systemic abyss, and that mistake will not be repeated. In a systemic crisis today, it will take unprecedented currency and credit creation by the central banks to save the financial world. And it’s that debasement that will end up collapsing fiat currencies.

Meanwhile, we can expect central banks to milk the transitory inflation story for all its worth. Forget the CPI rising at 8%+ they will say. It will soon return to the 2% target as recession bites. But that’s another excuse to ease policy. It might buy just a little more time before the crisis hits. But don’t bank on it.

Manipulation becomes official
Earlier this month, three JPMorgan Chase traders faced a federal trial in Chicago, accused of masterminding a massive eight-year scheme to manipulate international markets for precious metals by spoofing, including gold and silver. JPMorgan had already been fined $920m in 2020.

Coincidently, Peter Hambro who was a gold trader in London in the early days of the derivatives market described how the bullion banks created unallocated gold accounts. One of Hambros’ more interesting comments was about the role of the authorities:

Read more at: https://www.zerohedge.com/markets/gold-upcoming-recession

Interested? Want to learn more about the community?
What else you may like…
Videos
Podcasts
Posts
Articles
Pay Attention Here...😉

These two crypto Ponzi schemes are about to collapse…

👉 Sharplink Gaming & Microstrategy

Source: @chooserich 🗣️

00:04:41
Introducing Arc, the home for stablecoin finance.

Arc is an open Layer-1 blockchain purpose-built to drive the next chapter of financial innovation powered by stablecoins.

Designed to provide an enterprise-grade foundation for payments, FX, and capital markets, Arc delivers the performance, reliability, and liquidity builders need to meet global financial demands.

Arc features:
✅ USDC as native gas
✅ Built-in FX engine
✅ Deterministic sub-second finality
✅ Opt-in privacy
✅ Full Circle platform integration

Open, composable, and EVM-compatible, Arc is designed to interoperate seamlessly with the broader multichain ecosystem.

As part of our mission to advance blockchain infrastructure, we're excited to welcome the Malachite team and IP from Informal Systems to Circle. Arc is built on Malachite’s high-performance consensus engine.

In line with our commitment to open-source development, the core software for Arc will be released under a permissive license, enabling the broader developer community to contribute, extend, and build ...

00:02:50
The Stellar Foundation: Trustless doesn’t mean trust-free.

This weekend at Friends with Benefits FEST, we explored how protocol design, engineering, and community work together to make “trustless” systems work — and why trust matters for blockchain adoption.

00:00:35
👉 Coinbase just launched an AI agent for Crypto Trading

Custom AI assistants that print money in your sleep? 🔜

The future of Crypto x AI is about to go crazy.

👉 Here’s what you need to know:

💠 'Based Agent' enables creation of custom AI agents
💠 Users set up personalized agents in < 3 minutes
💠 Equipped w/ crypto wallet and on-chain functions
💠 Capable of completing trades, swaps, and staking
💠 Integrates with Coinbase’s SDK, OpenAI, & Replit

👉 What this means for the future of Crypto:

1. Open Access: Democratized access to advanced trading
2. Automated Txns: Complex trades + streamlined on-chain activity
3. AI Dominance: Est ~80% of crypto 👉txns done by AI agents by 2025

🚨 I personally wouldn't bet against Brian Armstrong and Jesse Pollak.

👉 Coinbase just launched an AI agent for Crypto Trading

PYTH NETWORK IS FINALLY IN THE TOP 100

The universe confirms with an 888

❤️ the synchronicity ✨️

post photo preview
Can't keep up with all these 🚀

Mix it up 🥣

$MYX is the native token of @MYX_Finance, a 👉 Pyth pilled perpetual DEX, and its feed is now live across 100+ blockchains.

https://x.com/PythNetwork/status/1958892001346429006

Tokenized Gold XAUm is building on @SuiNetwork’s DeFi ecosystem at full speed, bringing 99.99% purity physical gold to fuel the next wave of #SuiDeFi

From the first-ever XAUm price #Oracle to DEXs, lending markets, and #AI vaults, XAUm is fueling #liquidity & #access on Sui from Day 1:

🔹 @SlushWallet (Wallet)
🔹 👉 @PythNetwork (XAUm Oracle)
🔹 @MMTFinance Momentum (DEX)
🔹 @Official_NODO (AI LP vaults)
🔹 @navi_protocol (Lending)
🔹 @AlphaLendSui (Lending)
🔹 @AlphaFiSUI (Lending vaults)

Next week, we will share more exciting insights on the incentive program with each partner. Follow us to learn more.

https://x.com/matrixdock/status/1958849330439495898

post photo preview
Pyth Network (PYTH) To Rally Higher? This Emerging Fractal Setup Saying Yes!

The cryptocurrency market is undergoing a healthy cooldown as Ethereum (ETH) eases to $4,440 from its recent peak of $4,780. The pullback has weighed on most major altcoins — including Pyth Network (PYTH) — which is down about 5% over the past week.

But while the short-term dip might look discouraging, PYTH’s chart is showing something far more interesting: a price structure that mirrors the exact same bullish breakout pattern that sent Skale (SKL) soaring by triple digits earlier this month.

PYTH Mirrors SKL’s Breakout Structure

A glance at SKL’s daily chart reveals a textbook falling wedge formation — a well-known bullish reversal pattern. Once SKL broke above the wedge and printed a higher high followed by a higher low, it flipped both the 200-day and 100-day moving averages into firm support. That technical shift triggered a 148% rally in just days.

PYTH appears to be tracing the same path.

Like SKL, PYTH has already broken out from its falling wedge and formed a higher high and higher low. It is now consolidating just beneath a critical confluence of resistance, with the 100-day MA at $0.1235 and the 200-day MA at $0.1481 — a setup eerily similar to SKL’s pre-breakout structure.

What’s Next for PYTH?

For the bullish fractal to fully play out, PYTH will need to close decisively above the $0.1235–$0.1481 zone, ideally on rising volume. A confirmed breakout could open the door to the first upside target of $0.21, representing roughly 78% potential gains from current levels.

However, confirmation is key. Until PYTH clears these moving average hurdles, it remains vulnerable to extended consolidation or even a false breakout. Still, the fractal similarity to SKL is hard to overlook — and if history repeats, PYTH bulls could be on the verge of a major move.

Source

🙏 Donations Accepted 🙏

If you find value in my content, consider showing your support via:

💳 PayPal: 
1) Simply scan the QR code below 📲
2) or visit https://www.paypal.me/thedinarian

🔗 Crypto – Support via Coinbase Wallet to: [email protected]

Read full Article
post photo preview
Deep Dive into Pyth Network 💎💎💎💎💎
👉From November 2024😉

What are Oracles?

Blockchains in and of themselves are useful already, for trustless and permissionless transactions without censorship. No trust or verification from the user is required because it is stored on a decentralised ledger with global consensus. What if certain transactions require reliable and real-time data from external sources that do not necessarily have a global consensus or can be stored on the same ledger? For example:

  • Products that rely on price feeds of assets from other blockchains or real-world markets: Many decentralized finance (DeFi) applications, like decentralized exchanges or lending platforms, need accurate and timely information about asset prices (e.g., stocks, cryptocurrencies, commodities). Since these prices are continuously changing in real-world markets, blockchains need a way to securely access this off-chain data.
  • Products that require verifiable and secure random numbers: Randomness is crucial for a variety of blockchain use cases, such as lotteries, gaming, and even secure cryptographic protocols. However, generating truly random numbers on-chain is challenging without introducing bias or predictability. Off-chain randomness, when provided by a reliable source, is often needed.
  • Products dependent on historical price data: Some DeFi platforms and financial products might need access to archived price data for risk assessment, backtesting trading strategies, or offering historical analysis. Since blockchains primarily focus on storing current state information, they need external sources to provide this historical data efficiently.

To address these challenges, Oracles were introduced. Oracles serve as bridges between blockchains and the external world, providing smart contracts with access to off-chain data. They connect external data providers—such as market data owners, web APIs, or IoT devices—to decentralized applications across multiple blockchains. Oracles enable these applications to securely and reliably obtain real-time data, execute transactions based on external events, and interact with data that cannot be directly stored on-chain.

Why can this data be trusted? Oracles provide a robust mechanism for ensuring the integrity and reliability of off-chain data before it is used on the blockchain. An oracle network verifies the:

  • Authenticity: To ensure that the data is genuine and comes from a legitimate source, oracle networks source data from multiple trusted providers or verifiable APIs. This process reduces the risk of malicious or false information being introduced into smart contracts.
  • Accuracy: Accurate data is crucial for smart contracts to function correctly. Oracles achieve this by aggregating data from several independent sources. Instead of relying on a single provider, an oracle network will query multiple data sources and compare their responses.
  • Reliability: Oracle networks enhance reliability by using decentralized nodes, which increases resilience against failures or malicious activity. If one data source or node fails or provides incorrect information, the other nodes in the network can continue to operate and provide valid data.

The demand for accurate and reliable off-chain data is growing as the number of real-world use-cases and adoption of blockchain increases. Users of applications are more than willing to pay for an oracle service that is accurate and reliable and covers a large variety of use-cases.

Pyth Network versus Other Oracles

Read the blog post of Battle of the Oracles to learn more about the different oracles solutions. To recap, Pyth Network is a high-frequency oracle leveraging Solana's technology, offering a robust solution for off-chain data sharing for primarily decentralized finance applications (DeFi). It provides services like real-time price feeds and benchmarks, accessible to a wide range of financial service providers. PYTH is the governance token and utility token of the Pyth Network. Supply and demand for the PYTH token is directly related to level of usage and total demand of Pyth’s services and Pyth Network’s Tokenomics.

Total Value Secured by Oracles

While Chainlink holds the lion’s share of the total value secured by oracles, Pyth has shown by far the largest growth in terms of TVS, number of protocols supported and number of DApps. Pyth is expanding rapidly, across different networks and protocols, supporting more DApps, data providers and integration partners every day. In the same time frame, Chainlink’s marketshare has decreased. Comparing the main metrics of MCAP/TVS ratio and MCAP/TTV ratio, we notice that based on market capitalization (circulating supply), Pyth is undervalued whereas the TVS ratio based on fully diluted value paints a different picture. This is because only 37% of PYTH tokens are unlocked, the next significant PYTH token unlock takes place in May of 2025 and happens yearly thereafter on the same date until the full amount of tokens has been unlocked by 2027.

Use-cases Enabled by Pyth

Products and Services:

  • Price Feeds: real-time market data for smart contracts, blockchains, and applications
  • Benchmarks: historical market data for smart contracts, blockchains, and applications
  • Express Relay: smart contracts or protocols that need protection against MEV (Express Relay) Express Relay is one of a kind product that offers developers to auction off valuable transactions directly to MEV searchers without validator interference
  • Entropy: smart contracts that require secure on-chain random numbers. Secure and verifiable random numbers are incredibly important for creating a fair and unpredictable on-chain actions (e.g., for games)
  • Pyth DAO Governance model

Examples:

  • Decentralised Exchanges (DEXs) require reliable real-time price feeds to provide users accurate trades.
  • Pyth’s data pull model provides data directly from the source, such as exchanges, market makers or DeFi protocols. Because data is pulled only on demand and not pushed at a given interval, it scales efficiently, and costs are offloaded to users where updates are demand-based.

Case Study: Drift (DEX)

Refresher: What is a DEX?

Decentralized Exchange (DEX) allows users to trade cryptocurrencies directly, without intermediaries, using smart contracts on a blockchain. DEXes operate peer-to-peer, providing greater privacy and control over assets compared to centralized exchanges.

There are two main types of DEXes:

  1. Order Book DEXes: These platforms match buy and sell orders using a live order book, similar to traditional exchanges. Examples include dYdX.
  2. Automated Market Makers (AMMs): AMMs use liquidity pools and algorithms to determine asset prices, allowing users to trade instantly without needing a counterparty. Examples include Uniswap and SushiSwap.

Context

Drift is a perpetual trading DEX built on Solana. Speed, reliability, and performance make or break a perpetual trading ecosystem. Drift is a perpetual trading platform that allows traders to create leveraged positions against the performance of synthetic assets.

Why Pyth?

Drift seeks to offer the most feature-rich, powerful perpetual DEX with lightning-fast execution. This ambition necessitates a robust Oracle solution. Legacy oracles are slow and susceptible to front and back running.

Pyth and Drift partnered to rapidly deploy a proof-of-concept. This successful relationship satisfies the ultra-fast network requirements of Drift’s execution tools and is capable of supporting thousands of users and hundreds of assets.

This is only one of many examples of an effective partnership and integration that gives Web3 users an enhanced user experience than DApps that use other Oracle solutions. There are presently over 410 integration partners supporting the transition from push to pull Oracles with Pyth Networks.

Pyth versus Chainlink

We compare Chainlink and Pyth Network with two main metrics: Total Value Secured (TVS) and Total Transaction Volume (TTV)

Total Value Secured

Pyth’s Total Value Secured (TVS) is more distributed across different blockchains and applications compared to Chainlink, offering greater resilience and diversification. Here's how the comparison breaks down:

  • Blockchain Distribution: Pyth’s TVS shows a broader spread across multiple blockchains. For instance, only 61.1% of Pyth’s TVS is concentrated on the Solana blockchain, which means the remaining value is distributed across other blockchains, contributing to its decentralized footprint. In contrast, 97.1% of Chainlink’s TVS is concentrated on Ethereum, creating a higher dependence on a single blockchain. This heavy reliance on Ethereum makes Chainlink more vulnerable to network-specific issues, such as scalability concerns or market downturns affecting Ethereum.
  • Application Distribution: Pyth also demonstrates a healthier diversification across different applications. Only 23.8% of Pyth’s TVS is tied to its top application, meaning the remaining value is distributed among various other applications. This broader application spread lowers the risk of one dominant app affecting the network’s overall performance. Chainlink, however, has 48.8% of its TVS tied to its top application, meaning nearly half of its secured value relies on a single application. This concentration creates a potential single point of failure, making Chainlink more sensitive to shifts in the usage or success of that key application.

Pyth's more balanced distribution of TVS across different blockchains and applications enhances its resilience. With a healthier spread of its value, Pyth is better positioned to withstand market fluctuations or downturns that may affect individual blockchains or applications, making it less exposed to risks associated with dependency on any single network or product. This diversified approach gives Pyth a structural advantage in terms of long-term stability and adaptability.

Total Transaction Volume

Another, perhaps better, metric to measure the true market share and usage of an Oracle network is TTV (Total Transaction Volume). TTV is strongly correlated with the frequency of oracle price updates and therefore oracle revenue and true demand for its products and services. TVS can overstate or understate an application’s demand for price updates, because an application could have a disproportionate amount of locked value relative to the amount of Oracle interactions one would expect to observe.

Chainlink, the traditional market leader of oracle networks, is losing ground after being slow to serve customers needing faster data updates, though they've recently launched a new high-speed service. Pyth has become a successful competitor by focusing on rapid data delivery across multiple platforms, making it easier for financial applications to access real-time price information. Large trading platforms are increasingly building their own internal price tracking systems rather than paying external providers, suggesting cost is a major factor in their decisions.

The key to future success in digital trading will be speed - traditional exchanges currently have an advantage with their centralized systems, but new platforms are starting to close this gap by developing faster price update capabilities.

Pyth Network Governance

The Pyth Network operates a decentralized governance system that empowers the community by allowing all PYTH token holders to have a direct say in the network's development and decision-making processes. This decentralized governance model ensures that control of the network is distributed among its users, promoting transparency and inclusion.

To participate in governance, token holders must stake their PYTH tokens through the Pyth staking program. By staking their tokens, users gain the ability to vote on community governance proposals, ensuring that they have a voice in the key decisions shaping the future of the Pyth Network.

In addition to voting, any PYTH token holder has the right to submit proposals to the Pyth DAO, provided they meet the requirement of holding and staking at least 0.25% of the total PYTH tokens staked. The proposals that can be brought to the DAO are diverse and impact many critical aspects of the network's functionality, including:

  • Determining the size of update fees: Proposals can influence the fees charged for updates to the network, ensuring that they remain fair and competitive.
  • Reward distribution mechanisms for publishers: The community can vote on how rewards are allocated to data publishers, ensuring that those contributing accurate and reliable data are fairly compensated.
  • Approving software updates across blockchains: The Pyth Network operates across multiple blockchains, and governance participants have the power to approve essential updates to on-chain programs, ensuring the network remains up to date and secure.
  • Listing price feeds and determining their reference data: Token holders can vote on which price feeds are listed on Pyth, as well as set the technical parameters for these feeds, such as the number of decimal places in the prices and the reference exchanges used to determine the data.
  • Selecting data publishers: The governance system allows the community to permission publishers, or select which entities are allowed to provide data for each price feed. This ensures that only trusted and verified data sources are contributing to the network.

Conclusion

The Pyth Network stands out as a disruptive force in the decentralized oracle space, rapidly growing across protocols and blockchains and setting new standards for both data speed and diversification. Leveraging Solana technology, Pyth brings high-frequency, real-time market data directly from first-party sources—including exchanges and trading firms—to an expanding universe of DeFi and TradFi applications. Compared to its primary competitors, Pyth demonstrates healthier resilience by distributing its Total Value Secured across multiple blockchains and applications, reducing dependencies and systemic risk.

Recent market trends show Pyth gaining ground in metrics like Total Transaction Volume, challenging traditional leaders like Chainlink and reflecting a broader shift toward fast, reliable, and diversified data solutions in decentralized finance. Its innovative approach—such as direct publisher sourcing, sub-second updates, and auditable aggregation—addresses the needs of financial markets with unique precision and transparency.

Ultimately, for developers, institutions, and investors seeking reliable off-chain data with speed and global reach, Pyth Network is quickly becoming a cornerstone oracle solution—and its trajectory signals a new era of dynamic, decentralized connectivity for global finance.


Source

🙏 Donations Accepted 🙏

If you find value in my content, consider showing your support via:

💳 PayPal: 
1) Simply scan the QR code below 📲
2) or visit https://www.paypal.me/thedinarian

🔗 Crypto – Support via Coinbase Wallet to: [email protected]


Read full Article
post photo preview
Understanding the Crypto Alt Season

The next altcoin season is poised to ignite the crypto market, promising to turn savvy investors' portfolios into goldmines. As Bitcoin's dominance wanes, a new era of blockchain innovation is dawning—are you ready to ride the wave?

Market behavior often exhibits distinct patterns and cycles. One such phenomenon that has captured the attention of traders and investors alike is the "Alt Season"—a period when alternative cryptocurrencies, or "altcoins," outperform Bitcoin and experience significant price surges.

The concept of market cycles and seasonality is not unique to crypto; it's a well-established principle in traditional financial markets. However, in volatile crypto space, these cycles can be more pronounced and occur with greater frequency.  

In this article, we’ll try to cover these and other topics: 

  1. The nature and characteristics of Alt Seasons
  2. The importance of recognizing market cycles in cryptocurrency trading
  3. Alt Season indicators and how to interpret them
  4. Predictions and speculatins about the next potential Alt Season

What Is Crypto Alt Season?

Crypto Alt Season, short for "Alternative Cryptocurrency Season," refers to a period in the cryptocurrency market when alternative cryptocurrencies (altcoins) significantly outperform Bitcoin in terms of price appreciation. During an Alt Season:

  1. Many altcoins experience rapid price increases.
  2. The market share of altcoins grows relative to Bitcoin.
  3. Trading volume for altcoins typically increases.
  4. Investor attention shifts from Bitcoin to various altcoin projects.

An Alt Season can last anywhere from a few weeks to several months. It's often characterized by increased risk appetite among investors, who are willing to allocate more capital to smaller, potentially higher-risk crypto projects in search of higher returns.

Is Crypto Season the Same As Crypto Alt Season?

While related, Crypto Season and Crypto Alt Season are not exactly the same:

  1. Crypto Season:
    • Refers to a broader bullish period in the entire cryptocurrency market.
    • Typically includes price appreciation for both Bitcoin and altcoins.
    • Can be longer in duration, sometimes lasting for many months or even a year or more.
    • Often starts with a Bitcoin rally, followed by increased interest in the broader crypto market.
  2. Crypto Alt Season:
    • Specifically focuses on the outperformance of altcoins compared to Bitcoin.
    • Can occur within a broader Crypto Season but is more narrowly defined.
    • Generally shorter in duration than a full Crypto Season.
    • May happen towards the latter part of a broader Crypto Season, as investors seek higher returns in smaller cap coins.

Key Differences:

  • Scope: Crypto Season encompasses the entire market, while Alt Season focuses on altcoins.
  • Duration: Crypto Seasons are generally longer than Alt Seasons.
  • Market Dynamics: In a Crypto Season, Bitcoin often leads the rally, while in an Alt Season, altcoins outperform Bitcoin.

It's important to note that these terms are not officially defined and can be subject to different interpretations within the cryptocurrency community. However, understanding the distinction can help investors and traders better analyze market trends and potential opportunities in different segments of the crypto market.

What Is Alt Season Indicator?

The Alt Season Indicator is a tool used by cryptocurrency traders and investors to gauge whether the market is entering or currently in an "Alt Season" — a period when altcoins are outperforming Bitcoin. While there isn't a single, universally accepted Alt Season Indicator, several metrics and tools are commonly used to assess the likelihood of an Alt Season. Here are some key aspects of Alt Season Indicators:

Bitcoin Dominance

One of the most widely used indicators is Bitcoin Dominance, which measures Bitcoin's market capitalization as a percentage of the total cryptocurrency market cap.

  • Calculation: (Bitcoin Market Cap / Total Crypto Market Cap) * 100
  • Interpretation: A declining Bitcoin Dominance often signals a potential Alt Season, as it indicates that capital is flowing from Bitcoin into altcoins.
  • Threshold: Some traders consider Bitcoin Dominance below 50% as a potential indicator of an Alt Season.

Altcoin Market Cap Ratio

This indicator compares the total market capitalization of altcoins to Bitcoin's market cap.

  • Calculation: Total Altcoin Market Cap / Bitcoin Market Cap
  • Interpretation: An increasing ratio suggests growing strength in the altcoin market relative to Bitcoin.

Top 10 Altcoins Performance

This indicator tracks the performance of the top 10 altcoins by market cap (excluding Bitcoin) compared to Bitcoin over a specific period.

  • Calculation: Average percentage gain of top 10 altcoins vs. Bitcoin's percentage gain
  • Interpretation: When a majority of top altcoins consistently outperform Bitcoin, it may indicate an Alt Season.

Alt Season Index

Some crypto data platforms offer a proprietary Alt Season Index, which combines various metrics to provide a single score indicating the likelihood of an Alt Season.

  • Scale: Often presented as a percentage or a 0-100 score
  • Interpretation: Higher scores (e.g., above 75%) suggest a higher probability of an ongoing Alt Season

Trading Volume Ratios

This indicator compares the trading volumes of altcoins to Bitcoin's trading volume.

  • Calculation: Total Altcoin Trading Volume / Bitcoin Trading Volume
  • Interpretation: An increase in this ratio may indicate growing interest in altcoins, potentially signaling an Alt Season.

Important Considerations:

  1. No single indicator is foolproof. Traders often use a combination of indicators for a more comprehensive analysis.
  2. Market conditions can change rapidly, and past patterns don't guarantee future results.
  3. Different traders may use different thresholds or interpretations of these indicators.
  4. The crypto market's evolving nature means that indicators may need to be adjusted over time to remain relevant.

Understanding and effectively using Alt Season Indicators can help traders and investors make more informed decisions about allocating their resources between Bitcoin and altcoins. However, it's crucial to combine these indicators with broader market analysis and risk management strategies.

Alt Seasons: Historical Perspective, Current Situation, and Future Predictions

Previous Altcoin Seasons

In crypto, two periods stand out as particularly significant for altcoins. These "alt seasons" saw unprecedented growth and interest in cryptocurrencies beyond Bitcoin, reshaping the landscape of digital assets.

The 2017-2018 Alt Season

Duration: December 2017 to January 2018

Context:

  • Bitcoin (BTC) experienced its most remarkable bull run to date, reaching nearly $20,000 in December 2017.
  • This surge in Bitcoin's price and public interest created a ripple effect throughout the crypto market.

Key Developments:

  1. Proliferation of New Coins: The success of Bitcoin catalyzed the launch of numerous new cryptocurrencies.
  2. Investor Frenzy: Buoyed by Bitcoin's success, investors eagerly sought the "next Bitcoin," pouring capital into various altcoins.
  3. ICO Boom: This period saw a surge in Initial Coin Offerings (ICOs), with many projects raising millions in a matter of hours or days.
  4. Market Expansion: The total cryptocurrency market cap reached unprecedented levels, briefly surpassing $800 billion in January 2018.

Notable Altcoins: Ethereum (ETH), Ripple (XRP), and Litecoin (LTC) saw significant price increases during this period.

The 2020-2021 Alt Season

Duration: December 2020 to April 2021

Context:

  • Bitcoin broke its previous all-time high, surpassing $60,000 in March 2021.
  • The COVID-19 pandemic had accelerated digital adoption and increased interest in alternative investments.

Key Developments:

  1. DeFi Explosion: Decentralized Finance (DeFi) projects gained massive traction, with many tokens seeing exponential growth.
  2. NFT Boom: Non-Fungible Tokens (NFTs) entered the mainstream, driving interest in blockchain-based digital assets.
  3. Institutional Adoption: Major companies and institutional investors began adding cryptocurrencies to their balance sheets.
  4. Technological Advancements: Many altcoins introduced innovative features, scaling solutions, and use cases.

Notable Altcoins: Ethereum (ETH) reached new highs, while projects like Binance Coin (BNB), Cardano (ADA), and Polkadot (DOT) saw remarkable growth.

Comparative Analysis: Both alt seasons shared some common characteristics:

  • They were preceded by significant Bitcoin price rallies.
  • New projects and tokens gained rapid popularity and valuation.
  • Retail investor participation increased dramatically.
  • The overall cryptocurrency market capitalization reached new heights.

However, the 2020-2021 alt season was marked by greater institutional involvement and a broader range of technological innovations, particularly in DeFi and NFTs.

Is It Alt Season?

Based on the indicators discussed above, it's not currently an altcoin season. The Altcoin Season Index at 41 and Bitcoin's market dominance at 61.3% both suggest that Bitcoin is still the dominant force in the crypto market at this time.

When Is Alt Season?

Based on the information we could gather from various experts, we can analyze the predictions for the next altcoin season as follows:

  • Based on the latest analysis from experts and on-chain data, here’s what we know about the next altcoin season:


    Current Status (August 2025):


    • The altcoin season index—a metric that signals how many altcoins outperform Bitcoin—currently sits around 37. For a “full-blown” alt season, it typically needs to rise above 75.

    • Bitcoin dominance is approximately 61-62%. Historically, dropping below 60% often coincides with a rapid rotation into altcoins and the start of alt season.


    Key Indicators to Watch:


    • Altcoin Season Index (ASI): Above 75 signals a true altcoin season.

    • Bitcoin Dominance: A move below 60% usually marks the transition; sub-50% dominance is associated with peak alt season inflows.

    • Market Activity: Increasing volumes in major altcoins and Layer 1s, meme coin rallies, and spikes in DeFi activity are early warning signs.

    • Ethereum Outperformance: When ETH surges relative to BTC, this historically precedes broader altcoin rallies.


    Expert Predictions for 2025:


    • Analysts point to a pivotal window for alt season starting as early as August 2025 and extending through the fall, with many expecting true acceleration of altcoin gains if Bitcoin’s price consolidates and capital rotates further into alts.

    • There is strong consensus that macroeconomic catalysts, such as potential U.S. interest rate cuts and ongoing Bitcoin ETF momentum, could fuel a major altcoin rally in late 2025 if positive conditions persist.

    Summary Table: Key Factors & Targets

    SignalAlt Season TriggerStatus (Aug 2025)
    Altcoin Season Index (ASI)>75 ~37
    Bitcoin dominance<60% ~61–62% (near trigger)
    Altcoin trading volumeSustained surge across many alts Rising, but not explosive
    Ethereum outperformanceETH/ BTC breakout, >$3,700 Near, ETH ~$3,500
    Market narrativesAI, DeFi, meme coins, new L1 inflows Strengthening
     

    Bottom Line:
    Most analysts agree the groundwork for altcoin season in 2025 is building. We are currently in a transition phase: if Bitcoin dominance continues to fall and the Altcoin Season Index rises above 75, a full-fledged alt season could ignite during the second half of 2025. Monitor these key indicators to stay ahead as market momentum shifts from Bitcoin into a broader range of altltcoins.

Key Factors to Consider

  • Technology: Look for coins with innovative solutions to existing blockchain challenges.
  • Adoption: Consider projects with growing partnerships and real-world use cases.
  • Market Position: Established coins with room for growth may offer a balance of stability and potential returns.
  • Tokenomics: Understanding supply dynamics can help predict potential price movements.

It's crucial to conduct thorough research before investing. The cryptocurrency market is highly volatile, and past performance doesn't guarantee future results. Always invest responsibly and within your risk tolerance.

How to Win in Next Alt Season?

Capitalizing on the next altcoin season requires a strategic approach. Here's how to maximize potential gains:

  • Research and Diversification: Thoroughly research potential investments, analyzing both fundamentals and technical aspects to identify promising altcoins. Diversify your holdings across different projects to mitigate risk and maximize potential returns. Don't put all your eggs in one basket.
  • Strategic Timing: Utilize technical analysis tools like support/resistance levels and RSI to pinpoint optimal entry and exit points. Monitor market sentiment and price trends to make informed decisions. A clear entry and exit strategy is crucial for managing risk and maximizing profits during volatile periods.
  • Newer Projects: Consider participating in newer altcoin projects. This provides early access to potentially high-growth projects at discounted prices. Research upcoming defi projects with use cases, focusing on innovative projects with strong potential. Investing early can yield substantial returns as the project develops.

Conclusion

In summary, an altcoin season, marked by significant price increases in non-Bitcoin cryptocurrencies, may be on the horizon.  This potential surge could be driven by investors seeking higher returns in smaller-cap cryptocurrencies, technological advancements in altcoin projects, increased blockchain adoption, and the transition of projects from speculative ventures to real-world applications

Remember, while the potential for significant gains exists during an altcoin season, the cryptocurrency market remains highly volatile. Always invest responsibly.

Source

🙏 Donations Accepted 🙏

If you find value in my content, consider showing your support via:

💳 PayPal: 
1) Simply scan the QR code below 📲
2) or visit https://www.paypal.me/thedinarian

🔗 Crypto – Support via Coinbase Wallet to: [email protected]

Read full Article
See More
Available on mobile and TV devices
google store google store app store app store
google store google store app tv store app tv store amazon store amazon store roku store roku store
Powered by Locals