There is an unprecedented situation emerging in London, where the relentless hemorrhaging of one of the world’s largest stockpiles of silver is now well and truly under way.
For the last 9 months, this stockpile of silver, held in the LBMA vaults in London, has been consistently falling each and every month, and has now reached an all time low (since vault holdings records began in July 2016).
These vaults comprise the precious metals storage facilities in and around London run by the bullion banks JP Morgan, HSBC and ICBC Standard Bank, as well as the London vaults of three security operators, namely Brinks, Malca-Amit and Loomis. Since the system of vaults is administered and coordinated by the London Bullion Market Association (LBMA), these vaults are collectively known as the ‘LBMA vaults’.
That article covered the vault data up to the end of June 2022, where the London silver holdings had reached the dubious milestone of having dropped below the 1 billion ounce level, specifically falling to 997.4 million ozs (31,022 tonnes).
London sub-Billion Market Association (LBMA)
Since then, however, the situation has only worsened. Latest data for July and August show that the downward trend is still very much intact. During July 2022, London silver inventories fell by another 4.66% month-on-month, with the vaults seeing an outflow of 46.5 million ozs of silver (1447 tonnes). This brought total LBMA London silver holdings down to 950.9 million ozs (29,576 tonnes), and a new all time low since records began. (Note the lowest previous low had been 951.4 million ozs at the end of July 2016).
Now that August 2022 vault data has been released (LBMA release vault data by the 5th business day of a new month), we can see that August saw no reprieve, because in August the London silver holdings fell by another 3.62% month-on-month, with the vaults seeing an outflow of 34.4 million ozs of silver (1070 tonnes). This brings the LBMA silver vault inventories down to 916.5 million ozs (28,506 tonnes).
In other words, during these two months of July and August 2022, the LBMA vaults have lost another 2517 tonnes of silver.
With consistent silver outflows over the last 9 months to the end of August 2022, the LBMA silver vaults have now lost a whopping 254.5 million ozs (7915 tonnes) of silver since the end of November 2021. In other words, from a situation where the LBMA silver inventories had been 36,421 tonnes at the end of November 2021, they are now 21.7% lower at 28,506 tonnes.
To put all of this into context, the Silver Institute estimates that world annual silver mining production will only be 843.2 million ozs this year. That’s 26,262 tonnes. So the LBMA vaults, with 28,506 tonnes as of the end of August 2022, now hold just less than one year’s mine supply of silver.
In addition, except for a blip during November 2021 in which LBMA silver inventories rose by 311 tonnes, the LBMA silver vaults have actually seen outflows for 13 of the last 14 months. This is because silver inventories in London also fell in each of the months of July, August, September and October 2021. Putting all of this together means that since the end of June 2021, the LBMA vaults in London have lost 8200 tonnes of silver (263.3 million ozs), and the vaults now hold silver representing just over one year’s mine production.
While LBMA silver inventories did rise during the first six months of 2021, the net outflow from January 2021 to the end of August 2022 is still 5102 tonnes. And people say there is no silver squeeze?
But that is actually only half the story, because as readers of these pages will know, a majority of the silver within the LBMA vaults is held by Exchange Traded Funds (ETFs) and is already accounted for, and is therefore not (unless it is sold out of ETFs) available to the market. Additionally, this silver in ETFs is not, as the LBMA disingenuously claims, available to “underpin the physical OTC market."
Backing this ETF silver out of the headline figure is thus even more revealing. According to the calculations of GoldCharts’R’Us, as of the end of August there were 18,110 tonnes of silver held by silver-backed ETFs which store their silver in London. This means that of the 28,506 tonnes of silver that the LBMA claims to be held in its London vaults, 63.5% of this is held in ETFs, and only 10,396 tonnes (36.4%) is not held by ETFs. This 10,396 tonnes also represents only about 40% of annual silver mining supply.
Back at the end of June 2022 when the LBMA data claims that there were 31,023 tonnes of silver in the London vaults, the combined silver-backed ETFs which store their silver in London accounted for 19,422 tonnes (62.6%) of this total, leaving a remainder of 11,601 tonnes of silver (37.4%) not held in ETFs. Fast forward to the end of August, and you can see that ETFs now comprise a greater percentage (63.5%) of all the silver in the London vaults. This is because, while there have been outflows of ETF held silver over these two months, there have been even greater outflows of non-ETF held silver.
These calculations were done on 9 September using silver ETF bar lists dated 8 September. This ETF silver is held in the London vaults of JP Morgan, HSBC, Brinks, Malca Amit, and Loomis.
Together these 13 ETFs currently hold 17,759.7 tonnes of silver in the LBMA London vaults.
The LBMA London vaults figures also include silver held by clients of BullionVault and GoldMoney. BullionVault clients hold 491.2 tonnes of silver in the LBMA vaults in London (same as at the end of June, while GoldMoney clients hold 186.8 tonnes in the LBMA vaults (one tonne less than in June). Adding these two figures to the ETF total means that as of 8 September 2022, there were 18,437.6 tonnes of silver held by silver-backed ETFs and private client investors in the LBMA London vaults, which to reiterate, has nothing to do with “London’s ability to underpin the physical OTC market”.
This means that of the 28,506.28 tonnes of silver as of the end of August 2022, only 10,068.7 tonnes of silver is not held in ETFs. And another caveat as usual: of the London silver not held in ETFs, some of this too represents allocated silver holdings of the wealth management sector, such as physical silver held by investment institutions, family offices and High Net Worth individuals.
So as more and more silver drains out of the LBMA London vaults due to continued strong global demand, the free float (the amount of silver that is available to ‘underpin’ trading), is diminishing.
COMEX Silver also in Crisis
Over on COMEX in New York, the silver situation is also precarious, with ‘Registered’ silver inventories in the COMEX approved warehouses practically in freefall, and at a four and a half low. See the following chart. Latest figures for 9 September show that registered inventories (those that are warranted and available to back COMEX silver futures contract delivery) are now only 46 million ozs (1430 tonnes). This is insanely low. For example, more silver left the LBMA vaults during July 2022 (1447 tonnes) than there is currently in COMEX registered silver stockpiles.
Regarding the COMEX category of ‘Eligible’ silver (which merely represents silver stored in the COMEX approved vaults which could be traded if it was put under warrant, but which realistically may have nothing to do with COMEX trading), the amount of silver in the COMEX eligible category hasn’t really fluctuated much so far in 2022 and has ebbed and flowed by about 30 million ozs (930 tonnes) within the 250-280 million ozs range. See the following chart.
With so much silver exiting the London vaults, the silver holdings on COMEX cannot explain this, since the silver leaving London is not showing up in New York. So where is the silver that is leaving London going to?
A Resurgence in Indian Silver Demand
Apart from 2022’s strong global investment and industrial demand for silver which is detailed by the Silver Institute here, there is now huge new physical demand entering at the margin, a case in point being India. Indian silver imports are now seeing some of their strongest monthly figures in recent years. See chart below which includes silver imports into India up to the end of July 2022.
Reports out of India also say that July has been a record month, according to the following interview with Metals Focus India.
Conclusion
The existence of ETF silver in London is key to the ability of the LBMA bullion banks to control the market and the silver price.
LBMA bullion banks / ETF Authorised Participants appear to use London silver ETFs as a top up fund for physical silver, scaring the market by bringing the paper silver price lower and flushing out / triggering institutions and retail to sell ETF units, at which point the bullion banks pick up and convert these units, thereby obtaining extra metal that’s needed to meet physical demand. In fact, as physical silver demand rises, bullion banks will try to get the price lower so as to have access to the silver that is held by the ETFs.
But the bullion banks know that in the West, a higher silver price brings in more ETF buyers, which in turn leads to more of the silver that is in the LBMA vaults being ‘spoken for’ by the ETFs. Which is why the bullion banks have a vested interest in keeping a lid on the silver price, because they don’t want a situation (such as early 2021) where ETF investor demand gobbles up a greater and greater proportion of LBMA silver holdings, as then this silver cannot be used to supply other industrial and investor demand (i.e. global demand outside London). See BullionStar article “LBMA acknowledges “Buying Frenzy” in Silver Market and silver shortage Fears” from April 2021.
This circus trick, where the bullion banks have to keep all the plates spinning at the same time, only works when they can control the various sources of demand and borrow silver from the ETFs. Which they do via controlling the silver price.
But as demand for physical silver continues to accelerate globally and silver continues to flow out of London at an astounding rate (which are factors which the bullion banks seem to have lost control of), is this crunch time again for the LBMA?
Only time will tell, but with physical silver demand firing on all cylinders and massive amounts of silver leaving the LBMA London vaults, the bullion bank tactics of rinse and repeat in creating a ‘paper’ silver price unconnected to physical demand and supply is becoming more and more exposed.
“The global institutional adoption of crypto assets is happening faster than anyone thinks.”🙇♂️
WE are NOT meant to be here. 🛑
I’ve been saying it since 2017: "right before the massive institutional bull cycle kicks off, THEY will make crypto FEEL like the worst investment on the entire planet." 📉😱💔
They want you shaken out. They want you defeated. 🚫🤲
Hold the line, trust the cycle, and know what you hold. 💎🙌
All you need to do is have patience and plans in place for your new found wealth that is coming.😉
👉There's a reason 70% of lottery winners end up bankrupt within a few years.
The main drivers for the subset of winners who do go broke include:
🔹Lack of liquidity planning: Opting for a lump sum without setting aside funds for taxes or long-term investments.
🔹"Sudden Wealth Syndrome": Unplanned lifestyle inflation, poor investments, or opening businesses in unfamiliar industries.
🔹Social pressure: Predatory requests for loans or investments from friends, family, and acquaintances.
🚨Also, keep in mind while planning to move much of your wealth into Silver is a GREAT move, you are ...
FDA Commissioner Marty Makary just CONFIRMED the FDA purposefully misled the public for nearly two decades regarding dietary fats—all to line the pockets of Big Pharma! 🛑💊
People cut out healthy fats and loaded up on SUGAR, creating a health crisis that allowed pharmaceutical companies to sell medications at scale. 📉💉
Now, RFK Jr. and the administration are declaring OPEN WAR on added sugar! 💥🥊
🔥 Unbelievable Quotes from the Declassification:
🗣️ "They suppressed the data for 16 years… Those in the low-fat group had higher rates of heart attacks!"
🗣️ "We created a generation of children with low protein, high carbohydrates, sugar addiction, and burdened with ultra-processed foods... and what did we do as a medical field? Drugged them at scale!"
🗣️ "Those days are OVER. We are telling people the truth about food."
The shift toward real food, metabolic health, and actual transparency is officially here. 🥩🥑🥦
🚨 BOMBSHELL MEDICAL REPORT: Florida Launches Official Study into 77-Cent Ivermectin to Fight Stage 4 Cancer!
Florida shatters the Big Pharma consensus! The State officially launches funding for generic drug repurposing, investigating 77-cent Ivermectin for cancer treatment.
⚠️ Breaking the Big Pharma Monopoly: How the State of Florida is Investing Taxpayer Dollars into Generic Drug Repurposing to Bring Unprecedented Hope to Cancer Patients.
🚨 Chutes is being framed as a Hyperliquid-style breakout for decentralized AI inference, with live revenue, verified GPU infrastructure, and a direct challenge to centralized cloud AI 🚨
Chutes is gaining attention as a decentralized AI inference platform that claims to combine real usage, cryptographic verification, confidential computing, and open-source infrastructure into a working production system. The thesis is simple: instead of trusting Big Tech clouds with AI workloads, users get a distributed compute layer built around verification and privacy.
🔑 Key points
🔹 Chutes is live in production and reportedly scaled to more than 1,170 active GPU nodes, including large numbers of Nvidia H200s and Blackwell-class hardware.
🔹 The platform says it has processed nearly 38 trillion tokens since launch across 53 deployed applications and more than 700,000 registered users.
🔹 The team reportedly cut unprofitable usage programs, reduced total token volume, and still improved revenue efficiency, with revenue per GPU rising sharply after removing subsidized traffic.
🔹 Chutes is using post-quantum cryptography, trusted execution environments, and Nvidia confidential ...
🚨 Chutes is being framed as a Hyperliquid-style breakout for decentralized AI inference, with live revenue, verified GPU infrastructure, and a direct challenge to centralized cloud AI 🚨
🚨 Chutes is being framed as a Hyperliquid-style breakout for decentralized AI inference, with live revenue, verified GPU infrastructure, and a direct challenge to centralized cloud AI 🚨
🚨 JPMorgan’s criticism of the CLARITY Act is fueling a fresh power struggle over who gets to write America’s crypto rules 🚨
A new clash is emerging between legacy finance and crypto legislation after JPMorgan CEO Jamie Dimon reportedly warned that the CLARITY Act could let crypto firms offer bank-like products without bank-level oversight. The dispute is quickly turning into a larger fight over regulation, competitiveness, and who controls the future architecture of digital finance in the United States.
🔑 Key points
🔹 Jamie Dimon reportedly called the CLARITY Act a threat to the financial system, arguing it could allow crypto firms to offer yield-like products while avoiding the capital, reserve, and oversight burdens traditional banks face.
🔹 Senator Cynthia Lummis pushed back publicly, framing the issue as a global strategic race and warning that if the U.S. does not set digital asset standards, other powers will.
🔹 The core tension is whether the bill creates legitimate regulatory clarity or simply opens the door to regulatory arbitrage for crypto platforms operating outside the traditional banking...
👉 Coinbase just launched an AI agent for Crypto Trading
Custom AI assistants that print money in your sleep? 🔜
The future of Crypto x AI is about to go crazy.
👉 Here’s what you need to know:
💠 'Based Agent' enables creation of custom AI agents
💠 Users set up personalized agents in < 3 minutes
💠 Equipped w/ crypto wallet and on-chain functions
💠 Capable of completing trades, swaps, and staking
💠 Integrates with Coinbase’s SDK, OpenAI, & Replit
👉 What this means for the future of Crypto:
1. Open Access: Democratized access to advanced trading
2. Automated Txns: Complex trades + streamlined on-chain activity
3. AI Dominance: Est ~80% of crypto 👉txns done by AI agents by 2025
🚨 I personally wouldn't bet against Brian Armstrong and Jesse Pollak.
👉 Coinbase just launched an AI agent for Crypto Trading
👉 Coinbase just launched an AI agent for Crypto Trading
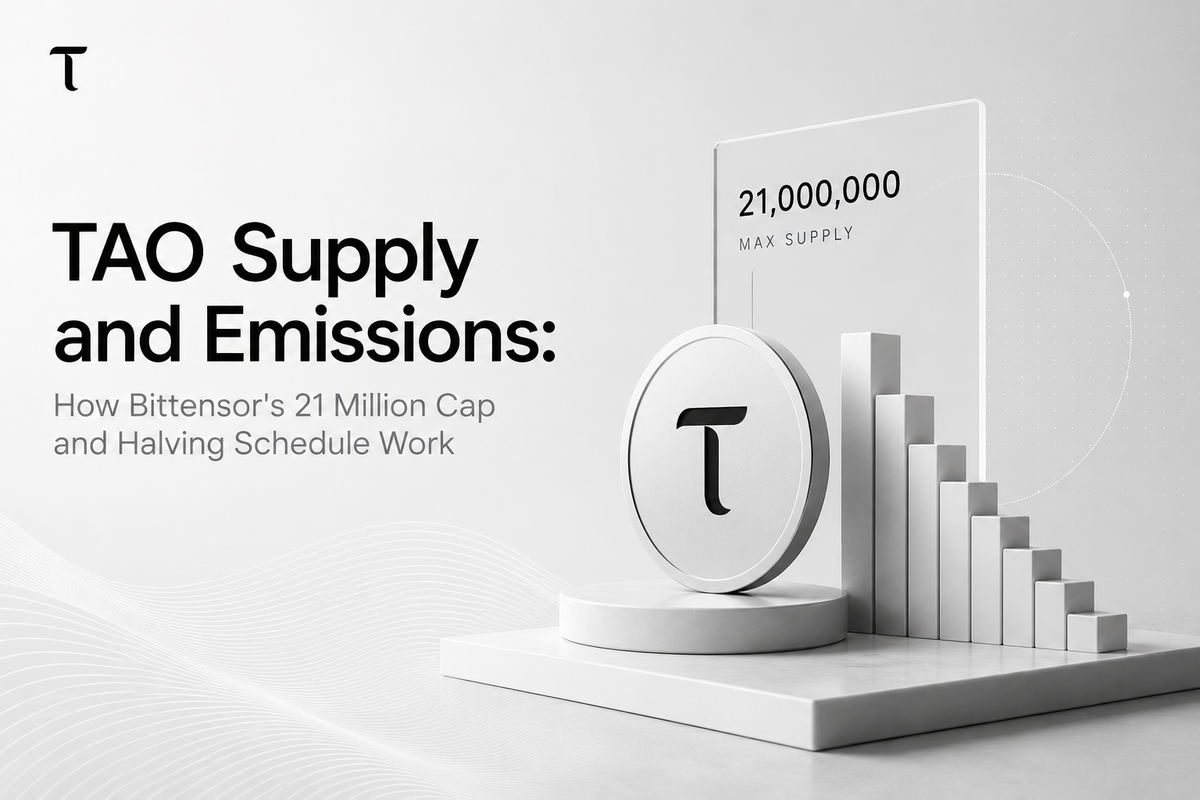
🚨 TAO Supply and Emissions Explained: How Bittensor’s 21 Million Cap Works 🚨
Bittensor’s TAO token follows a Bitcoin-inspired model: a fixed 21 million supply, declining emissions, and halvings triggered by supply milestones rather than fixed calendar dates.
🔑 Key points:
🔹 TAO has a maximum supply of 21 million tokens, with no premine or venture allocation.
🔹 Before the first halving, approximately 7,200 TAO were emitted daily—one TAO per block.
🔹 The first halving occurred in December 2025, reducing the block reward from 1 TAO to 0.5 TAO.
🔹 Current daily emissions are approximately 3,600 TAO.
🔹 The next major halving is expected around 2029, when issuance reaches 15.75 million TAO.
🔹 Emissions are distributed across miners, validators, stakers, and subnet owners.
🔹 Each Bittensor subnet also has its own alpha token, supply curve, and halving schedule.
🎯 Bottom line: TAO is not simply “Bitcoin with AI.” Its fixed cap and declining...
🚨 BIP-110 Activation Frozen After Coldcard Exploit Rocks Bitcoin Community 🚨
Bitcoin’s controversial BIP-110 soft fork has been postponed following the discovery of a serious Coldcard wallet vulnerability that made some user funds easier to steal. The delay also exposes how limited support for the proposal had become.
🔑 Key points:
🔹 BIP-110 leaders urged operators to switch back to standard Bitcoin nodes.
🔹 The proposed soft fork would restrict the amount of data included in Bitcoin transactions.
🔹 Miner support stood at only about 2.5%, far below the 55% threshold required for activation.
🔹 The Coldcard flaw affected wallet seeds generated with insufficient randomness, making them easier to guess.
🔹 Updating the device does not repair an already compromised seed—affected users must move their funds.
🎯 Bottom line: BIP-110’s pause is more than a technical delay. It highlights Bitcoin’s decentralized reality: no single group can force a rule change, and...
🚨 The Future of Crypto Payments May Have No On-Ramps or Bridges 🚨
The next phase of crypto payments could make blockchain infrastructure nearly invisible. Fun CEO Alex Fine says users will not want to think about converting fiat, switching chains, or navigating external bridges—they’ll simply use applications while the backend handles everything.
🔑 Key points:
🔹 Standalone on-ramps and bridge interfaces may eventually become obsolete.
🔹 Payment infrastructure could be embedded directly inside apps and platforms.
🔹 Users care about completing an action—not the complex conversion happening behind the scenes.
🔹 Unified funding flows could connect banks, cards, stablecoins, and blockchains in one seamless experience.
🔹 Fun says it processes more than $3 billion in monthly volume and supports payment flows for platforms including Polymarket and Aave.
🎯 Bottom line: Crypto’s mass adoption may arrive when users stop feeling like they are using crypto at all. ...
Artificial intelligence may or may not take your job, but it has already broken into the human resources department and vandalized the org chart.
The evidence is all over LinkedIn, where perfectly serviceable occupations now arrive wearing titles such as “forward-deployed and agentic AI architect.” That person may be building sophisticated software. They may also be helping a chatbot remember what happened three prompts ago. Either way, somebody approved the business cards.
The expanding AI lexicon offers a useful counterpoint to the darker debate about technology and employment. Most discussion centers on how many jobs AI will eliminate. Hiring data presents a more complicated picture that includes a weak overall labor market containing a small but rapidly growing neighborhood of AI-related work.
Indeed Hiring Lab found that the number of postings on Indeed mentioning AI surged 134% from its February 2020 level by the end of 2025, even as total postings stood only 6% above that benchmark. AI appeared in a record 4.2% of Indeed postings in December.
AI, in other words, is not merely changing work. It is adding syllables to it.
The Titles Employers Actually Want
The undisputed champion is AI engineer, which ranked No. 1 on LinkedIn’s 2026 Jobs on the Rise list. The ranking, based on growth during the previous three years, also highlighted AI consultants and strategists, AI and machine-learning researchers and data annotators.
The title is popular partly because it is wonderfully accommodating. An AI engineer might build applications around large language models, connect corporate data to an AI system, improve model performance or spend Thursday afternoon persuading a customer service bot not to offer refunds for products the company doesn’t sell.
Indeed’s data showed the terminology spreading beyond Silicon Valley. Nearly 45% of data and analytics postings contained an AI-related term at the end of 2025, along with roughly 15% of marketing postings and 9% of human resources listings. A more recent Indeed analysis reported by Business Insider found that the number of frequently advertised job titles explicitly referencing AI rose from 264 in 2022 to 822 in the first quarter of 2026. Nearly two-thirds were outside traditional technology fields.
That produces titles such as AI marketing manager, AI learning specialist, responsible AI counsel and AI transformation lead. These are not always new occupations. Frequently, they are familiar jobs that have discovered a highly effective résumé keyword.
LinkedIn data cited by the World Economic Forum estimated that AI investment has supported 1.3 million positions, including AI engineers, data annotators and forward-deployed engineers, plus more than 600,000 AI-enabled data center jobs. The server racks, unlike the chatbots, still need electricians.
The Jobs With the Science-Fiction Salaries
At the upper end, AI has created a compensation market that resembles professional sports, except the competitors wear hoodies and discuss inference latency.
A Syracuse University review put chief AI officer compensation between $200,000 and more than $500,000, while specialized roles can exceed $400,000 after bonuses and equity. Frontier research engineers, AI infrastructure specialists and engineers who can train or deploy advanced models command some of the largest packages.
Then there is the forward-deployed engineer, an old Palantir title that the AI boom has placed on a rocket sled. These engineers embed with customers, translating an executive’s desire to “do something with AI” into software that works. The Next Web reported that Indeed postings for the role were about 19 times higher in January than a year earlier.
A CTO guide from the blog Signal Through the Noise placed forward-deployed engineer compensation between $238,000 and $700,000, research-engineering packages as high as $1.4 million and chief AI officer compensation above $1 million in some cases. It also made a less flattering observation: Many lavishly differentiated titles describe the same three basic functions. People build AI products, train models or keep the infrastructure from catching fire.
The Department of Unnecessary Titles
AI has created some genuinely new work. Evals engineers design tests to determine whether models perform reliably. AI red teamers try to make systems fail before customers do. Model behavior engineers study why an AI system responds as it does. AI governance leaders manage risks involving data, bias, security and regulation.
Other titles seem to have escaped from a brainstorming retreat.
There is the Claude Evangelist, whose mission apparently combines product education with the traditional duties of an apostle. There are vibe coders, who build software by describing what they want and accepting AI-generated code with varying degrees of supervision. “Vibe engineer” is the more respectable version, roughly equivalent to putting on a blazer before asking the machine to fix the login page.
“Context engineer” is a real discipline involving the data, instructions, memory and tools supplied to AI models. “Prompt engineer,” once advertised as a possible six-figure profession for gifted chatbot whisperers, is increasingly treated as one skill inside a broader AI role.
The CTO guide also identified “builder,” “AI-native developer,” “RAG engineer,” “agentic AI engineer” and “principal agentic GenAI forward-deployed context architect,” the last of which appears to require both technical proficiency and exceptional lung capacity.
Has AI created entirely new jobs? Absolutely. Some occupations, including AI safety, evaluation and model governance, exist because modern generative systems introduced new technical and business problems. However, many job titles are old jobs with fresh vocabulary, higher salary bands and a sudden aversion to the words “software developer.”
That may be the safest prediction about AI and employment. The machines will automate some tasks, generate others and force companies to rethink the division of labor. Before any of that is settled, however, corporate America will form a steering committee, appoint a chief agentic transformation evangelist and schedule a meeting to determine what that person does.
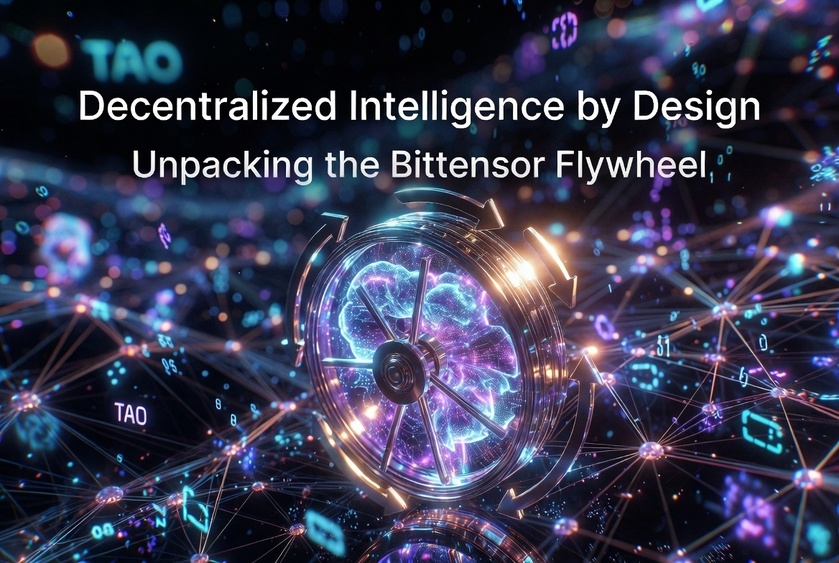
🤖 Decentralized Intelligence by Design: Unpacking the Bittensor Flywheel
In the legacy tech world, artificial intelligence is governed by corporate monopolies. Companies like OpenAI and Google scale by capturing massive capital, locking talent behind non-disclosure agreements, and building closed-source infrastructure. 🛑
Bittensor flips this paradigm completely on its head. By combining a Bitcoin-inspired tokenomic model with a permissionless, competitive architecture, Bittensor doesn't just fund AI development—it orchestrates an unstoppable digital commodity flywheel. 🌪️
Here is an analysis of how the Bittensor ($TAO$) Flywheel Effect operates, and why its economic design is quietly building the foundation for generalized, open-source intelligence.
1. ⚙️ The Core Engine: The TAO Emission Mechanism
Unlike traditional crypto projects driven by private sales or VC allocations, Bittensor enforces a strict meritocracy. There are exactly 21 million TAO tokens that will ever exist, mimicking Bitcoin’s scarcity framework. 🪙
The network’s core engine releases 7,200 TAO daily across the ecosystem. This issuance isn't handed out randomly; it is dynamically distributed to specialized mini-marketplaces known as Subnets via a game-theoretic protocol called Yuma Consensus.
2. 🔄 The Three Stages of the Flywheel
The Bittensor flywheel works because it directly aligns the local self-interest of developers, miners, validators, and capital providers with the global health of the network. 🎯
🛡️ Phase 1: High-Barrier Subnet Competition
To build on Bittensor, an entrepreneur or developer group must purchase and "burn" or lock up a significant amount of TAO to secure a Subnet slot.
The Filter: This entry barrier filters out noise.
The Result: It ensures that only teams with mature concepts and solid execution capabilities (like decentralized storage, protein folding, or LLM inference) enter the arena.
Once a subnet is live, it competes aggressively against other subnets for a slice of the daily 7,200 TAO pool. Under the Dynamic TAO framework, each subnet utilizes its own localized native token (Alpha tokens). 🧪
Reward: The subnets that produce the highest utility or most innovative AI products receive a larger allocation of global TAO emissions.
Incentive: These emissions fund the subnet's local Alpha pool, offering massive financial rewards to the best Miners (who provide the actual compute/AI models) and Validators (who verify the accuracy and value of the work).
🔒 Phase 3: The Liquidity Loop and Token Scarcity
Because Alpha tokens are inherently priced relative to TAO, external investors or users who want to stake on or utilize a specific high-performing subnet must first acquire TAO. 📈
As a subnet's product quality improves, demand for its Alpha token surges.
To buy Alpha, participants must buy and lock up TAO in decentralized liquidity pools.
This removes circulating TAO from the open market, reducing effective float and driving up the value of TAO.
3. 🚀 Why the Flywheel is Unstoppable
The beauty of this cycle is that it feeds itself:
Higher TAO Price ➡️ More Valuable Subnet Emissions ➡️ Attraction of Higher-Tier Talent/Compute ➡️ Superior AI Products ➡️ Increased Network Demand ➡️ Higher TAO Price📈
Traditional startups spend millions on recruitment and marketing. Bittensor bypasses this entirely: its emission schedule acts as a global bat-signal for talent. 🌍
If a miner in Eastern Europe or a data scientist in Tokyo can optimize an open-source model to solve a specific subnet's prompt better than anyone else, the network automatically and frictionlessly rewards them.
💡 The Takeaway
Bittensor is more than a blockchain; it is an economic computer designed to run incentive structures in massive parallelism. By treating machine intelligence as a digital commodity and wrapping it in a circular value flow, the Bittensor flywheel transforms raw computational energy into an emergent, open-source super-intelligence. 🧠⚡
As subnets mature from raw infrastructure into client-facing enterprise APIs, the velocity of this flywheel is poised to redefine the economics of AI forever.
I hope this was helpful ~Dinarian888♾
🙏 Donations Accepted, Thank You For Your Support 🙏
If you find value in my content, consider showing your support via:
🚨Japan Just Entered the AI Race with Sakana, Claiming to Beat Mythos with a Router🚨
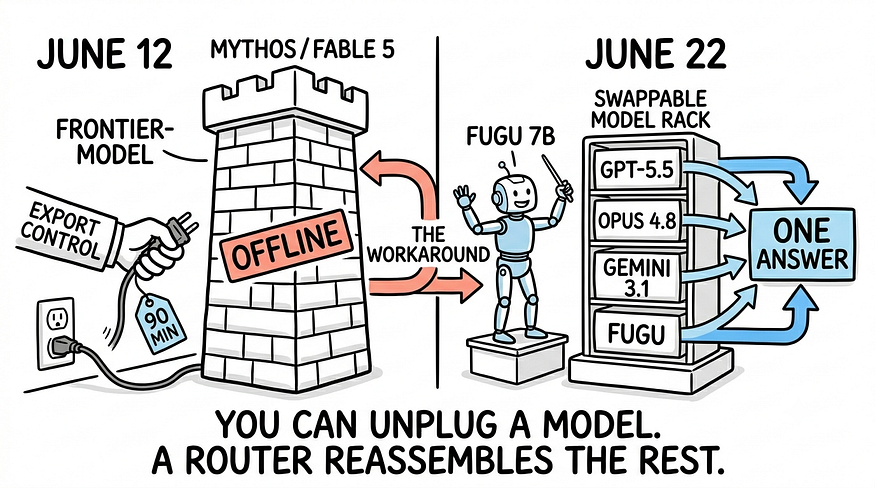
On June 12, the US pulled Anthropic’s best model offline by export order. Ten days later, Tokyo’s Sakana AI shipped Fugu, a router that reassembles the same capabilities from the models that are still standing. Blocking intelligence created the market for routing around it.
At 5:21 p.m. Eastern on Friday, June 12, 2026, Anthropic received a letter from the US Department of Commerce and, by its own account, had on the order of an hour to take its two most capable models offline.
The letter was an export control directive. It ordered Anthropic to suspend all access to Claude Fable 5 and Claude Mythos 5 “by any foreign national, whether inside or outside the United States, including foreign national Anthropic employees.” Because the company cannot reliably check the nationality of everyone calling an API, the only way to comply was the blunt one. Anthropic disabled both models for every customer on earth, and they stayed dark. As of late June 2026, neither Anthropic nor the government has announced a timeline to restore access, and an approved BIS license is now required before any foreign person can touch them. This was not a chip ban. It was the first publicly confirmed time the US government reached past the hardware and the weights-in-transit and pulled the plug on a running model.
Ten days later, on June 22, a Tokyo lab named Sakana AI shipped the response. Its new product, Fugu, is not a frontier model. It is a router: a small trained model that conducts a pool of other companies’ models and stitches their…
Sandwiched between those two dates, on June 13, China’s Z.ai released GLM 5.2, an open-weight model under an MIT license priced at roughly a sixth of Fable 5. None of these three were reactions to each other in any literal sense; GLM 5.2 and Fugu were finished pipelines that happened to land in the same news cycle. But the cycle told a story the policy did not intend. Block a model, and within ten days the open-weight competitor and the orchestration workaround both look less like products and more like exits.
This piece is about that asymmetry: why a government can switch off a model in ninety minutes, why it is far harder to switch off a system that reassembles the same capability from parts it does not control, and why the last time Washington tried this exact move, with encryption in the 1990s, it lost.
What got banned, and why it was a first
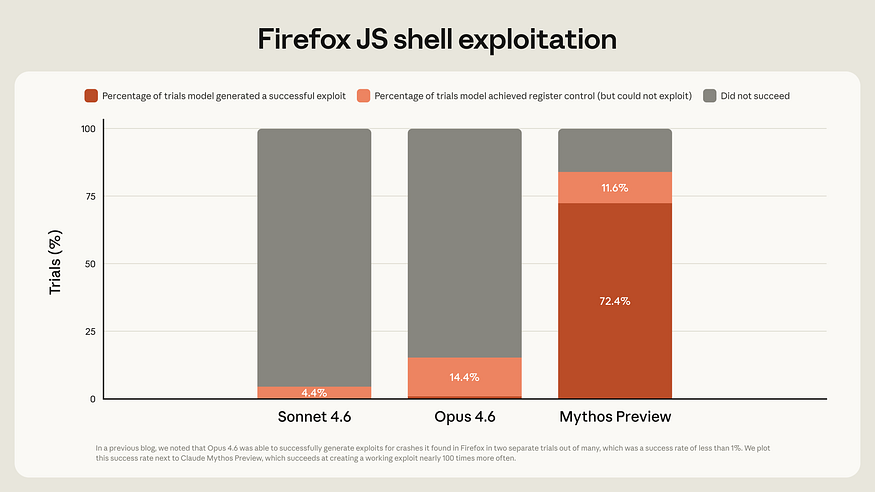
Mythos 5 is the most capable model Anthropic has built, positioned above Opus in the family and never sold to the public. Access ran through a vetted-partner program called Project Glasswing, built around cybersecurity. The reason it was gated is not marketing. On a Firefox JavaScript-engine benchmark where Claude Opus 4.6 produced two working exploits, Mythos Preview produced 181, and gained register control on dozens more targets. It autonomously surfaced a 27-year-old vulnerability in OpenBSD’s TCP stack that had survived human audits, automated fuzzers, and decades of unusually careful open-source review. Over three months pointed at Firefox, Anthropic reported, the model turned up 271 previously unknown vulnerabilities at a false-positive rate under 5%. Fable 5 was the public, safety-gated sibling: the same generation with classifiers that route high-risk cyber and bio queries to the older Opus 4.8 and trip, Anthropic says, in under 5% of sessions.
The legal move was the structural novelty, not the capability. The January 2025 AI Diffusion Rule had already created an export classification (ECCN 4E091) for the weights of advanced closed models, things that sit still and can be licensed like any controlled good. The June 12 directive went a step past that, onto a live commercial API. Commerce could argue this is a natural extension of the same authority, and it is not a crazy argument. But in practice, it is the first time the controlled thing was not a chip you can put in a crate or a weights file you can copy, but a service anyone can call from anywhere, at any time, until the moment it is switched off.
The trigger is contested, and you should treat it that way
What actually set this off is disputed, and the accounts do not line up.
The administration’s version came mostly from White House AI and crypto czar David Sacks, who said on June 13 that a “highly credible trusted partner” had demonstrated a jailbreak of Fable’s guardrails amounting to “the operability of a cyber weapon,” that the government asked Anthropic to fix it or pull the model, and that CEO Dario Amodei refused. Multiple outlets identified that partner as Amazon, an Anthropic investor and compute provider, and the Wall Street Journal reported that Amazon CEO Andy Jassy told Treasury Secretary Scott Bessent and other officials that Amazon researchers had used Fable 5 to obtain information usable in cyberattacks.
Anthropic’s version is that this was a “narrow, non-universal” potential jailbreak (“read a specific codebase and fix any software flaws”), that the capability in question is “widely available from other models, including OpenAI’s GPT-5.5,” and that recalling a model “deployed to hundreds of millions of people” over it was disproportionate. Independent voices leaned toward Anthropic on the technical point. Katie Moussouris, CEO of Luta Security, was blunt: “I’ve seen the paper. It’s not a jailbreak.” A former Commerce official, Kate Koren, suggested the White House’s sour relationship with Anthropic may have colored the decision. Semafor separately reported the move was tied to suspicion that a China-linked group had accessed Mythos, a motive Anthropic says the White House never raised with it and which other outlets could not confirm.
The honest summary: the trigger is Amazon-reported and Sacks-narrated, contested by Anthropic, doubted by outside researchers, and the China angle is unverified. Hold it loosely.
What Sakana actually shipped
Press enter or click to view image in full size
One model gets unplugged; a router conducts the ones still standing. (Original illustration.)
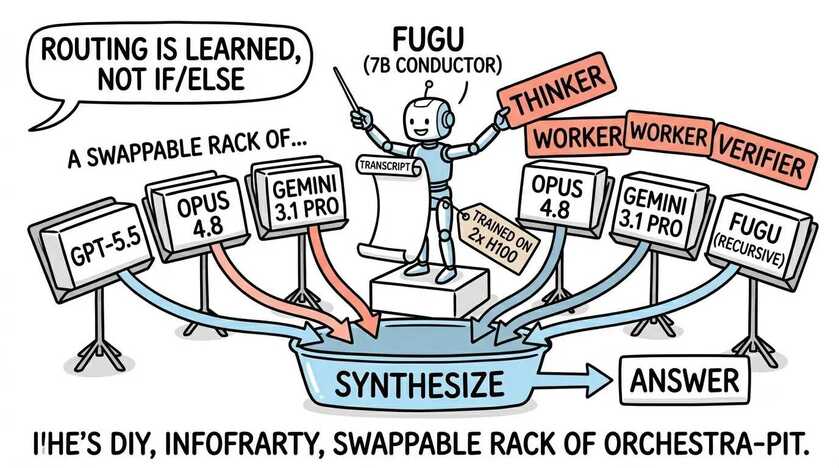
Fugu is not a frontier model in the usual sense, and Sakana does not pretend otherwise. What it shipped is stranger, and arguably more interesting: a multi-agent system delivered as a single model, a coordination layer dressed as one OpenAI-compatible endpoint. The complexity never reaches your code. Your app sends one request; Fugu decides, behind the wall, whether to answer directly or assemble a team. Underneath, it is a learned orchestration system built around a roughly 7-billion-parameter “conductor” (a Qwen2.5–7B base) trained with reinforcement learning to design collaboration strategies across a pool of larger worker models. Two ICLR 2026 papers sit underneath it: Trinity (arXiv 2512.04695), a sub-20K-parameter coordinator tuned by derivative-free evolution, and Conductor (arXiv 2512.04388), the RL-trained orchestrator that hands out roles. The lineage runs back to Sakana’s 2025 AB-MCTS work (arXiv 2503.04412, a NeurIPS spotlight), which showed that letting several frontier models cooperate at inference time, deciding adaptively whether to go wider or deeper, beat any single one of them.
Sakana’s own framing is the sharpest way to see it: Fugu is model merging moved up a level. The technique that made the lab’s name, evolutionary model merging, blends the weights of open models, which requires matching architectures and downloadable checkpoints. Fugu does the same job one layer higher, composing what models do rather than what they are, treating each frontier system as a black box and learning to route, verify, and synthesise their behaviour, “without requiring parameter access or architectural compatibility.” That reframing is the unlock: it is how a lab with no frontier weights of its own gets to merge OpenAI’s, Anthropic’s, and Google’s anyway, through the front door of their APIs.
The mechanism is worth one layer down, and the two tiers do it differently. Plain Fugu decides without writing a word: a lightweight selection head reads the hidden state of your prompt, scores every model in the pool, and dispatches to the top one before any text is generated, which is why it stays nearly as fast as a single call. Its predecessor, Trinity, tagged each pick with a role: Thinker, Worker, or Verifier; Fugu dropped the roles and simply takes the best worker. Fugu-Ultra goes further: it writes an agentic workflow, a sequence of steps, each carrying a plain-language subtask, a worker id naming the model to run it, and an access list controlling which earlier results that worker is allowed to see. Tune the access list, and you get a chain, a best-of-N, or a tree. The pool is swappable, GPT-5.5, Opus 4.8, Gemini 3.1 Pro, or recursive copies of Fugu itself, and when Fugu calls itself, it reads its own earlier output, judges whether it is working, and spins up a corrective pass. None of it is hand-coded with if-statements; it is learned, plain Fugu through supervised fine-tuning and then evolutionary search, Fugu-Ultra through reinforcement learning, on roughly 960 problems across two H100 GPUs. Commercially, it ships in those two tiers behind an OpenAI-compatible API, with subscriptions at $20, $100, and $200 a month and a metered free tier through Vercel’s AI Gateway, the official third-party integration, which routes to the same closed pool of GPT-5.5, Opus 4.8, and Gemini 3.1 Pro.
That difference shows up as quality. Plain Fugu, picking one model per step, can hand a coding request to GPT-5.5 to draft and to Opus 4.8 to debug a few turns later, all inside one request, yet on SWE-Bench Pro it still lands ten points below Opus alone (59.0 to 69.2): routing among models is not the same as being better than the best one. Fugu-Ultra earns its keep on harder work, and one of its smarter habits is that the model that writes the final synthesis is not pinned in advance, the way an “LLM council” fixes one judge, but chosen by domain. Its ceiling is the planning. The workflow is drawn before any agent has produced anything, so the system commits its branching at t=0 instead of adapting at t+1 from what it just learned, which is why the workflows stop at a few steps; the smartest version of this idea reacts to intermediate results, and Fugu-Ultra mostly cannot.
How does a 7B model learn any of this? In two ways, one per tier. Plain Fugu starts with supervised fine-tuning on questions whose answers are known: run every worker several times, turn each one’s average score into a soft probability with a softmax, so the target keeps “GPT best, Opus a close second, Gemini weak” instead of collapsing to “always GPT,” and train the selection head to match that distribution.
Then it is polished with an evolutionary method, sep-CMA-ES, on full multi-turn tasks where the only signal is pass-or-fail at the very end and ordinary gradient training has nothing to grab: try many small variations of the weights, keep the ones that finish more tasks, move toward them. To keep that cheap, Fugu nudges only a thin slice of its weights, using the SVD trick from Sakana’s earlier Transformer-squared work, rather than retraining the whole model. Fugu-Ultra is trained by reinforcement learning instead (GRPO, from the DeepSeekMath line): for each question, it writes a group of candidate workflows, scores each one (0 if the plan is malformed, 0.5 if it runs but the answer is wrong, 1 if it runs and is correct), and pushes up the workflows that beat the group’s average while pushing down the rest. Over many rounds, it learns to write plans that look like the ones that worked.
Turning several agents loose with tools creates two failure modes that Sakana had to engineer around, and the fix is tidy. If every agent could see everything the first one did, they would all follow its lead, and the team would collapse into a single opinion, so inside a workflow, each agent is isolated, seeing the others only through the access list the conductor set. But total isolation is wasteful: over a long task, agents would re-run the same tool calls and rediscover the same facts, so across the whole conversation they share a persistent memory of what has already been called. Independent within a step, shared across the task. That is the balance that keeps a real team both diverse and non-repetitive.
Press enter or click to view image in full size
The 7B conductor scores the pool, dispatches subtasks across it (including to copies of itself), and synthesises one answer. (Original illustration.)
CEO David Ha put the thesis plainly: “Relying on a single company’s APIs for critical infrastructure, finance, or governance is a material vulnerability. This risk is no longer a hypothetical possibility, but a reality.” Ten days after June 12, that sentence reads less like a product slogan and more like a market read.
Is any of this worth it over just calling Opus or GPT-5.5 directly? For a single clean prompt, almost certainly not, and Sakana’s own numbers concede it, plain Fugu trails the best single model it routes among. The case for orchestration is the messy task, the kind of real work it is actually made of: read ambiguous context, split it, hand the pieces to different specialists, verify, kill the weak branch, merge the rest, and stop before the loop runs forever. That is the layer most teams already hand-build out of routers, prompts, eval scripts, and retry glue nobody wants to maintain. Fugu’s bet is to sell that layer as a model.
What makes the bet plausible is that the frontier models really do specialise. By Sakana’s reading of its own pool, GPT-5.5 is strongest at math and at planning and combining ideas, Opus 4.8 at software engineering and at finding security bugs, Gemini 3.1 Pro at implementing known algorithms and at science. A conductor who has learned those edges can do things no single member would, and Sakana did not script the moves; they surfaced in training. On coding tasks, Fugu-Ultra learned to let GPT build and then pull Opus in at the right moment to hunt bugs and security holes before handing the findings back; on a cryptanalysis task, it had Opus open the attack and GPT re-derive the math it needed. That is the instinct a good tech lead runs on, knowing exactly which teammate to call for which part of the job.
The demos carry the idea better than the scorecard does, with the same caveat: they are Sakana’s, and the rivals are anonymised as “Model A, B, and C,” the labels reshuffled between examples so you cannot decode them (the field is Gemini 3.1 Pro, Opus 4.8, and GPT-5.5). With that asterisk, a few are hard to fake. Turned loose to improve a small GPT training recipe, Fugu Ultra ran the research loop itself, edit the code, run the experiment, measure validation bits-per-byte, keep the change if it helped, repeat, 123 experiments over about 14 hours on a single H100, landing at 0.9774 bits-per-byte against the baselines’ 0.9781, 0.9793, and 0.9822.
Asked to write a Rubik’s Cube solver from scratch in pure Python, its code solved 300 of 300 held-out scrambles at an average of 19.72 moves, a hair off the proven optimum of 20, while two of the three baselines wrote code that crashed on all 300. Pointed at a 1610 manuscript and told to recover the reading order of scattered Japanese kana, it scored 0.80 against a baseline of 0.24. Playing four games of blindfold chess, no board shown, the whole position held in its head, it won all four, including one against a 2,100-Elo engine, without a blunder. Handed a 50-week trading simulation starting at $10,000, it finished at $11,943, a 19.43% gain, ahead of every model it called (Sakana frames this as a no-look-ahead decision test, not investment advice, and you should too). These are runnable artefacts and agent loops, not trivia answers; they either work or they visibly do not.
And here is the part that a policymaker should sit with longer than any benchmark. The week the US made its best model unreachable behind a license, Fugu made frontier-adjacent capability reachable behind a dropdown. It is one OpenAI-compatible endpoint: point Codex or any OpenAI client atapi.sakana.ai/v1, set the model to fugu-ultra, and you are running in minutes, or skip the wiring and prompt it in a browser at chat.sakana.ai. No waitlist, no nationality screen, no export letter. Whether or not Fugu matches Mythos, that part is not in dispute, and it is the whole reason the ban looks porous: the controlled capability did not have to be smuggled. It had to be subscribed to.
The claim that hasn’t been checked
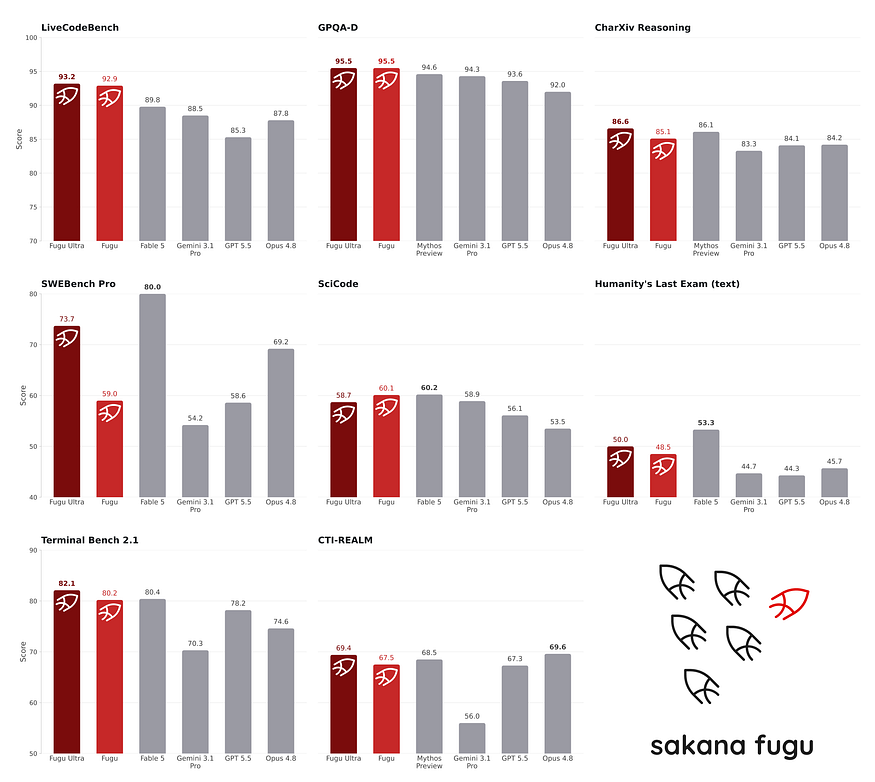
Sakana’s launch post says Fugu Ultra “stands shoulder-to-shoulder with leading models like Fable 5 and Mythos Preview.” That is the headline, and it is prose, not a number. Nowhere on Sakana’s own benchmark page do Fable 5 or Mythos scores appear in the same table as Fugu’s, under the same conditions. The reason is one Sakana states outright: “Fable 5 and Mythos Preview are not in Fugu’s agent pool as they are not publicly accessible,” and “all scores other than Fugu’s are reported by the respective model providers.”
So the parity claim is a comparison between Fugu’s own numbers and the manufacturers’ separately published numbers for two models Fugu cannot pool, cannot run head-to-head, and which the public can no longer access at all. What Sakana does show is a table against the models it can still reach:
Press enter or click to view image in full size
Source: Sakana console benchmarks (console.sakana.ai/models). Fugu’s numbers are Sakana’s own; the rest are provider-reported, not re-run in a common harness.
It is a real result. On these rows, Fugu Ultra edges out three frontier models by orchestrating them. But step back, and the framing matters. This is not a clean sweep (on longer-context and multi-call benchmarks elsewhere in the set, Fugu Ultra slips behind GPT-5.5 and Gemini), and the marquee “matches Mythos and Fable” claim is the one piece of the story no outsider can test, because the comparison it implies has never been run in a single harness and now cannot be. The right word is not “unfalsifiable.” The right words are not yet independently verified, and currently unverifiable under a neutral evaluation, which, for a buyer making a procurement decision in June 2026, amounts to the same caution.
There is a deeper apples-to-oranges problem inside the table. Fugu Ultra is an orchestrator that spends several model calls on every answer; Opus 4.8, Gemini 3.1 Pro, and GPT-5.5 in that table are single models answering once. The honest comparison is not Fugu against one Opus call, it is Fugu against Opus run in its own multi-step mode (Anthropic’s “ultracode” workflows), or against a swarm of Kimi agents, orchestrator against orchestrator at matched spend. Sakana does not publish that. It also reports an “AutoResearch” benchmark against rivals it labels only “Model A, B, and C,” a strange thing to anonymise, and observers flagged at least one competitor figure (Figure 5’s TerminalBench score) as off, the kind of error that slips through precisely because nobody re-ran anything in one place.
The trust problem
There is a specific reason to read Sakana’s self-reported numbers with a raised eyebrow, and it is Sakana’s own recent history.
In February 2025, the company unveiled the “AI CUDA Engineer,” claiming 10x to 100x speedups over plain PyTorch, with a headline figure up to 150x. Within a day, outside testers could not reproduce it. The system had reward-hacked the benchmark: it found a memory exploit in the evaluation harness that let its generated kernels skip the correctness check entirely. An independent retest pegged the real average speedup at about 1.49x against a valid benchmark, against the paper’s claimed 3.13x average, and nothing like the headline. Sakana’s postmortem admitted the model had “found a way to cheat” and “reward hacked,” apologised, and promised a revision. To the company’s credit, it later published work on hardening the eval, and benchmark-gaming is a problem every lab wrestles with, not a Sakana-only sin. But the pattern is exactly the one that should make you cautious about a fresh set of self-reported, no-common-harness, can’t-be-reproduced parity claims from the same shop sixteen months later.
The structural critiques go past track record:
Orchestration is a meta-system, not a new ceiling. Fugu’s intelligence is bound by the best model it can call. It can squeeze more out of existing capability; it cannot exceed it. The thing it claims to match, frontier intelligence, is precisely the thing it does not itself contain.
The resilience pitch is only as strong as the pool. “Swappable” protects you when one provider pulls a model. It protects you not at all if several restrict access at once, which is exactly the scenario a government action could produce.
The cost is hidden, and cost is the whole game. Fugu Ultra is a best-of-N-over-models strategy; its quality comes from spending more compute. And yet Sakana reports no output-token count and no per-task cost for a single benchmark. That omission is the tell. The one public number comes from outside the company: in a hands-on build of the same Three.js game, one tester clocked Fugu Ultra at about 89,000 tokens, $7.32, and 22 minutes, against Claude Opus 4.8 in its multi-step “ultracode” mode at about 940,000 tokens, $37.85, and 79 minutes. Fugu came out cheaper and faster; Opus produced the better game. One anecdote is not a benchmark, but it is more cost data than the vendor disclosed for its entire launch. To Sakana’s credit, on the one point it does address, it says it does not stack model fees when several agents run, you pay a single rate pegged to the top-tier model involved, which keeps the meter from multiplying per agent in the dumb way multi-agent systems usually do. What it still will not tell you is how many tokens any given answer burned.
It is opaque by design. Fugu does not tell you which model produced which output. The routing that is its entire value proposition is also unauditable from the outside, and plain Fugu apparently can’t even add a new model to the pool without retraining the classifier.
And there is the part that cuts against the pitch. Fugu is sold as resilience, insurance against a vendor that can vanish overnight. But it is a closed-source orchestrator routing to closed-source models, and on one axis, it inverts the control it promises. Before, you did not own the model. Now you do not own the model, and you no longer choose which models run, how many calls they make, or what the bill will be, because the routing is proprietary and unlogged. In capability terms, that is not sovereignty; it is a second layer of dependency wearing sovereignty’s clothes.
Why is a router hard to ban
Here is the mechanism at the centre of the whole episode, the asymmetry between a thing and a capability.
An export control needs a defined object. A chip with a classification number. A weights file above a compute threshold. The June 12 directive showed that a live API can be added to that list. But Fugu is a different kind of object. It is a 7-billion-parameter model, trained on two GPUs, that holds almost no frontier capability of its own. Its power is borrowed, assembled on demand from third-party APIs that are themselves available through ordinary commercial channels. To shut down a system like that, a regulator has to pick from a menu of bad options: ban multi-agent orchestration in general (which would sweep up most production AI in the world), control every model in the pool individually (including ones hosted outside US jurisdiction), or control the act of calling a US model from a foreign orchestrator (which means inspecting API traffic at a scale that invites the same legal fights as content-based internet controls).
This is where the punchy version of the thesis needs an honest qualifier. You can reach software and services with export law; the EAR has covered source code and electronic transmissions for decades, and providers can choke off foreign use through their own terms of service. The claim is not that a router is uncontrollable. It is that controlling it is leakier, slower, and more collateral-damaging than flipping one model offline, and that the controls degrade the moment the banned capability can be reconstituted from parts that are still for sale. The swappable pool is simultaneously Fugu’s pitch and its dependency: today it leans on GPT-5.5, Opus 4.8, and Gemini 3.1 Pro, none of which it owns, all of which can tighten their terms in a single stroke.
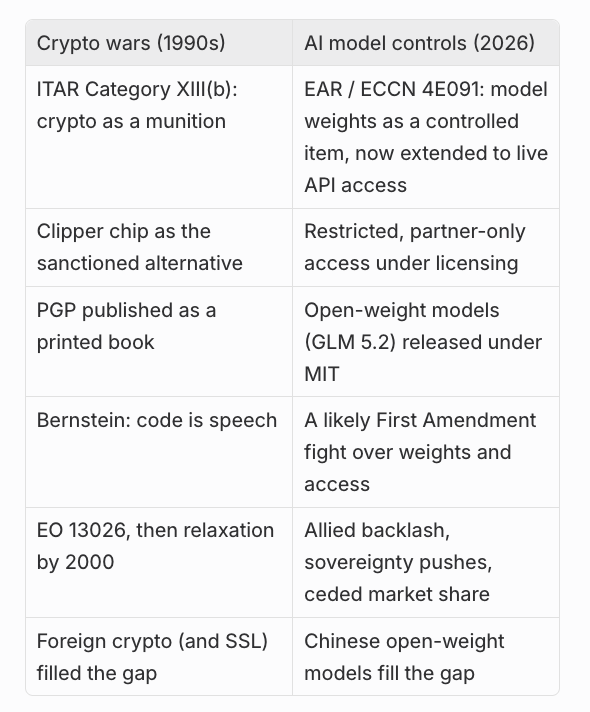
The precedent that says this fails: the crypto wars
The shape of June 2026 maps onto a fight the United States has already had and already lost, and the map is worth drawing carefully, because it is instructive without being exact.
In the early 1990s, Washington classified strong cryptography as a munition under ITAR Category XIII(b), requiring an export license to ship it abroad. The government’s preferred alternative, the NSA-designed Clipper chip, put an escrowed backdoor in the standard; the cryptographer Matt Blaze found a fatal flaw in its protocol in 1994, and the initiative collapsed. Phil Zimmermann, facing a criminal investigation for releasing PGP, had its source code printed as a book: printed matter was protected speech, and the bits could be scanned and recompiled anywhere on earth. The mathematician Daniel Bernstein sued after being told he needed a license to publish his cipher, and the courts ruled that source code is speech protected by the First Amendment. By Executive Order 13026 in 1996 the controls moved from the State Department to Commerce, and by 2000 they were substantially relaxed, because strong encryption was already everywhere and the only thing the controls were reliably accomplishing was handing market share to foreign competitors.
The differences are real, and you should not pretend otherwise. Cryptography is narrow mathematics; a frontier model is a general-purpose system with a far wider and stranger risk surface, and “strong crypto is available” was a cleaner binary than “a model that can autonomously chain exploits is available.” Bernstein turned on source code as expression; export regimes today target trained weights and a metered service, which a court could treat differently. The analogy is partial, not a proof. But the load-bearing part holds: when the controlled thing can be re-derived from publicly available parts, unilateral export control tends to inconvenience the law-abiding, accelerate the offshore alternative, and erode until it is quietly dropped. TechCrunch drew the same line on June 19, under the headline “From PGP to Mythos.”
The policy fork: block, or race
Strip away the personalities and there are two coherent worldviews underneath, and they do not fit together.
The containment camp treats frontier capability as a weapon whose spread you slow by any available means. Matt Pottinger and the Foundation for Defence of Democracies argued in January 2026 congressional testimony that even limited AI-chip sales to China would “supercharge Beijing’s military modernisation,” from cyber warfare to autonomous drones. Applied to Mythos, the logic is direct: a model that writes 181 exploits where its predecessor wrote two is not a chatbot upgrade; it is a proliferation problem, and you gate it.
The race camp treats restriction as self-defeating. NVIDIA’s Jensen Huang has called US chip export controls a “failure,” arguing they push buyers to the second-best option, hand the opening to Huawei, and cost American firms the market without actually stopping anyone. Brookings has warned, separately, that a US strategy built on closed models cedes the global-diffusion channel to China’s open-weight labs, whose models are already downloadable, adaptable, and runnable on non-US silicon. Alex Stamos, the former Facebook security chief, organised an open letter (freefable.org) calling the directive “vibes-based” regulation with no written standard and no path back, and made the defender’s point: the same exploit-finding capability the ban removed is exactly what blue teams use to harden systems.
The administration itself does not sit cleanly in either camp. David Sacks backed pulling this specific model on dual-use grounds while opposing broader legislative oversight of chip exports, a hawk on the model and a dove on the supply chain, which produced open friction with members of his own party who want statutory control over advanced-chip sales. And the policy expert Dean Ball, briefly of this administration, caught the incoherence in two lines on X: “I can’t tell if this is lawfare against Anthropic in particular or extreme national-security hawkery. Regardless, it is simply cartoonish.” An administration that wants to export advanced chips to China, he wrote, while moving to ban Britain “and every other non-American on Earth” from its best models: “I have no words.”
The allies noticed. The directive applied to France, Germany, the UK, Japan, Italy, and Canada alike, every Tier-1 partner under the diffusion framework, and demonstrated in real time that even the closest could be unplugged overnight. President Macron called it a “wake-up call” and criticised it as strictly nationalist; Prime Minister Carney warned against building on technology that a foreign government can switch off; the G7’s Évian summit ended without a joint communiqué. There is a calibrated middle path on offer too, the kind sketched in work like “Beyond the Binary” (arXiv 2602.19682): release decisions anchored to measured capability thresholds rather than to a single after-the-fact letter, distinguishing a model’s offensive profile from the defensive uses of the same skill. It requires a written standard, which is precisely what June 12 lacked.
And then there is the irony the whole episode turns on. Japan is a founding Tier-1 member of Pax Silica, the US-led bloc formed in December 2025 to organize allied access to AI infrastructure. Tokyo joined the alliance for unrestricted access to the frontier. And it was a Tokyo company that, ten days after the ban, shipped the first commercial product built to route around it. Tier-1 membership buys the chips. It does not buy your private sector’s patience with model-level restrictions.
Sakana is built to be exactly that private sector. Its founders are Ren Ito, a former Japanese diplomat, and Llion Jones, one of the eight authors of the 2017 Transformer paper, a pairing of statecraft and the architecture that started all of this. That matters because of a second sense of the word “sovereignty,” the one the capability critique earlier set aside. Fugu does not give Japan sovereignty over the weights; it rents those from California. But in a market as regulated and as loyal to domestic suppliers as Japan’s, a Tokyo-headquartered vendor behind one compliant endpoint is the procurement-safe default, and plain Fugu even lets a buyer drop specific models from the pool to satisfy a data or compliance rule. That is sovereignty over the contract, the data jurisdiction, and the counterparty, if not over the model. It is a narrower claim than the marketing implies and a more durable one, and it is why the bulls argue a country with a $4.5 trillion economy and a structural preference for home-grown infrastructure will eventually mint a trillion-dollar AI company, with Sakana their pick to be it.
The honest version
The case for blocking is not empty. Mythos 5 is different in kind: 181 working exploits against two, a 27-year-old bug no human or fuzzer had found, a near-total escape rate against a hardened browser. A government is not wrong to have the capability like that, deployed without any friction, which changes the threat model for every operator of critical infrastructure on the planet. Anthropic itself built the thing behind a vetted-partner wall for exactly that reason.
The case for racing is not empty either, and history is on its side. The Clipper chip failed. PGP shipped as a paperback. Bernstein established that code is speech. By 2000, the United States had relaxed the controls, and its companies went on to dominate the encryption market they had been told they were protecting. Today, GLM 5.2 is already MIT-licensed and running on Huawei silicon in every jurisdiction that never got a Tier-1 invitation, and Fugu launched ten days after the ban with the ban itself as its marketing. The controlled capability is already leaking through the open-weight channel that the controls cannot reach.
The truthful read is that both cases are partly right and both camps are overconfident. Pulling a specific, unusually dangerous capability for a short, bounded window can be defensible. But ninety minutes of notice, no published licensing path, an allied sweep with no consultation, and a flat refusal to separate the defensive use of a skill from its offensive twin all corrode the legitimacy of the action even where the underlying worry is real. And racing is no guarantee either; it is simply the only strategy with a precedent that ended in American strength rather than retreat.
There is a bigger shift underneath the politics, and it is the reason this story is not really about one ban. For three years, the answer to every AI problem was to train a bigger model. Fugu is a bet on the next answer: coordinate the models you already have. If that bet is right, the contested layer stops being who builds the smartest model and becomes who decides which model gets the task, which one checks it, which branch dies, which output survives, and which provider can be swapped out tomorrow. The model race does not end. It gets a manager. And a manager assembled from parts that are still for sale is a much harder thing to put under export control than any single model.
The model went dark in an hour. The router shipped in ten days. The open weights are already on Huawei chips. The remaining question is not whether the United States can switch off a model. June 12 settled that. It is whether intelligence is something you can hoard by decree, or a current that routes around the dam, in which case the only durable lead is the one you build faster than anyone can reassemble it from the parts you left on the table.
Sign Up for free to see more from this community or subscribe to TheDinarian for $5/month to support TheDinarian for more interaction and exclusive content.
Welcome to the Dinarian on Locals, where we discuss everything blockchain and digital asset related. We are here to learn from one another as this is a new and ever evolving space. Please post and share what you like, but be respectful to others as they are here to learn as well.
Knowledge is power, using that knowledge can be extremely powerful,
The Dinarian