(Dinarian Note: This would corolate 100% with CryptoCapos bounce to 21k before a dump to 16k and beyond...)
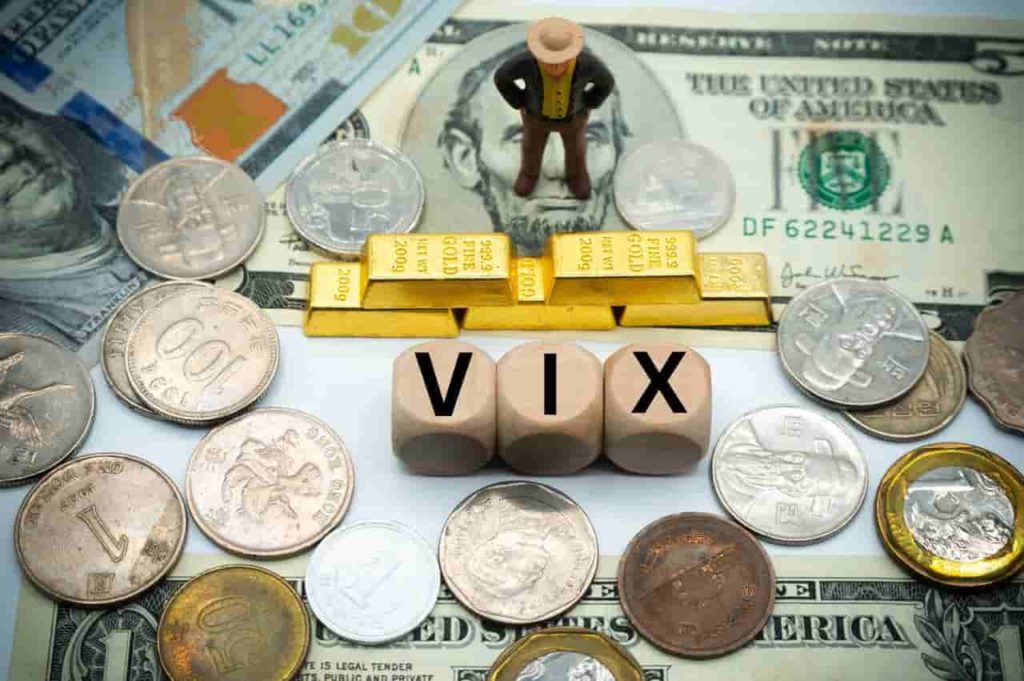
The Chicago Board Options Exchange (CBOE) volatility index (VIX) has often been the focus of discussions during troubling market times as it is often called Wall Street’s “fear gauge”, which is often closely correlated to the S&P 500 index.
When the S&P 500 touches new lows, the VIX often climbs to new highs, and market participants following technical signals often look to VIX to determine where the markets could be heading.
While it is difficult to find correlations to past performances in the stock market, the founder of Mott Capital, Michael J. Kramer, shared a chart on Twitter on October 13, showing a strong correlation between the VIX of 2008 and today’s VIX.

What does it mean?
If history is anything to go by, the market seems to be setting up for more volatility in the near term, at least according to the strong correlation between the VIX of 2008 and 2022. The last few months of the year are often the worst-performing months for the stock market as tax filings are being prepared and market participants are taking money out for some holiday shopping.
If this is set to play out the same as how it did in 2008, at the beginning of next year, markets could see high volatility and continued large corrections in stocks, especially the S&P 500 index.
Bear market bounce
Yesterday, October 13, the trading session was peculiar because stocks dropped fast once the latest inflation numbers came out, but at the end of the day, a rally occurred, and all earlier losses were recuperated.
💥Now, whether yesterday’s rally is simply the beginning of a bear bounce, which will crash hard towards the end of the year and continue into 2023, is anyone’s guess.💥