


Revolut’s mistake is the news, but the bigger problem is the growing number of companies being encouraged or required to keep copies of our most sensitive identity documents. |
Online bank Revolut has revealed that it gave out sensitive personal and financial information of an undisclosed number of its customers in response to a fake government request. The information that was handed over to an “unauthorized third party” reportedly includes names, dates of birth, occupations, addresses, phone numbers, account numbers, transaction histories (including Bitcoin), and even copies of government-issued IDs and onboarding verification selfies. Revolut claims that derived biometric face data was not. The company said that the data was handed over in response to an email that came from a real government agency’s domain, but was not actually sent or authorized by that agency. The email passed several authentication checks (SPF, DKIM, and DMARC) that are designed to establish the authenticity of a message’s origin and integrity, but do not verify the legitimacy of the legal request itself. Revolut said that it complied with the request “under the reasonable belief that it was an authentic government agency request” – and only later found out that it was not. Revolut said it later realized its mistake, blocked the email address, and reported the incident to the relevant authorities. Revolut said that only a “limited” number of its customers were affected by the data leak, and that the company’s systems were not hacked, nor was any money stolen. The story broke on September 11 when Revolut customers started receiving an email notice about a data leak, and the news was picked up by media outlets the following day.  The reason this is a recurring problem is that companies are keeping highly sensitive information about their customers’ identities, and sometimes even financial transactions, for a long time, and this data is then available to be disclosed to third parties – either in response to valid legal requests, or, as in the case of Revolut, fake ones. One reason for this is know your customer (KYC) and anti-money laundering (AML) rules. Revolut’s current UK customer privacy notice spells it out: the company generally keeps personal data of UK customers for no more than seven years after the relationship ends, and sometimes longer – for legal reasons. This means that even if you close your account, your identity documents don’t disappear. And while the incident with Revolut happened in the financial sector, it’s by no means the only one that requires customers to hand over sensitive identity information. Discord, a popular chat service, said in an October 9, 2025 security update that government ID photos of approximately 70,000 users may have been exposed after a third-party customer service provider got hacked. This was not a financial service, nor the same type of attack. But the result was similar – because the underlying business process was the same: requiring and storing sensitive identity documents. In the case of Discord, these were used to review age-related appeals. It’s hard to do anything about a copy of your old passport, or a photo of your face, or a record of your past transactions. These can be used to identify and profile you, and can be used to carry out targeted fraud. And this can happen even if the initial disclosure didn’t result in financial loss. The more companies are forced to collect and store such information, and the more of it they have, the more opportunities there are for this data to be leaked, either by the company itself or a third party it works with. That's what makes governments' push for more ID checks just to access ordinary parts of life so reckless.
🙏To support my work, Helping to keep the signal high and the noise low: 👉 Cashapp: $thedinarian 👉 Buy me a coffee: https://buymeacoffee.com/thedinarian 👉 PayPal: Scan the QR code below 📲 or Click Here:
👇 Crypto Donations 👇 XRP: r9pid4yrQgs6XSFWhMZ8NkxW3gkydWNyQX |

Dinarian888
?The Dinarian exists because the truth deserves a platform. Covering cryptocurrency, blockchain technology, global agendas, emerging science, and consciousness — because everything is connected and people deserve to know it. Knowledge is power. ?
Interested? Want to learn more about the community?

Dinarian888@dinarian888
March 29, 2024
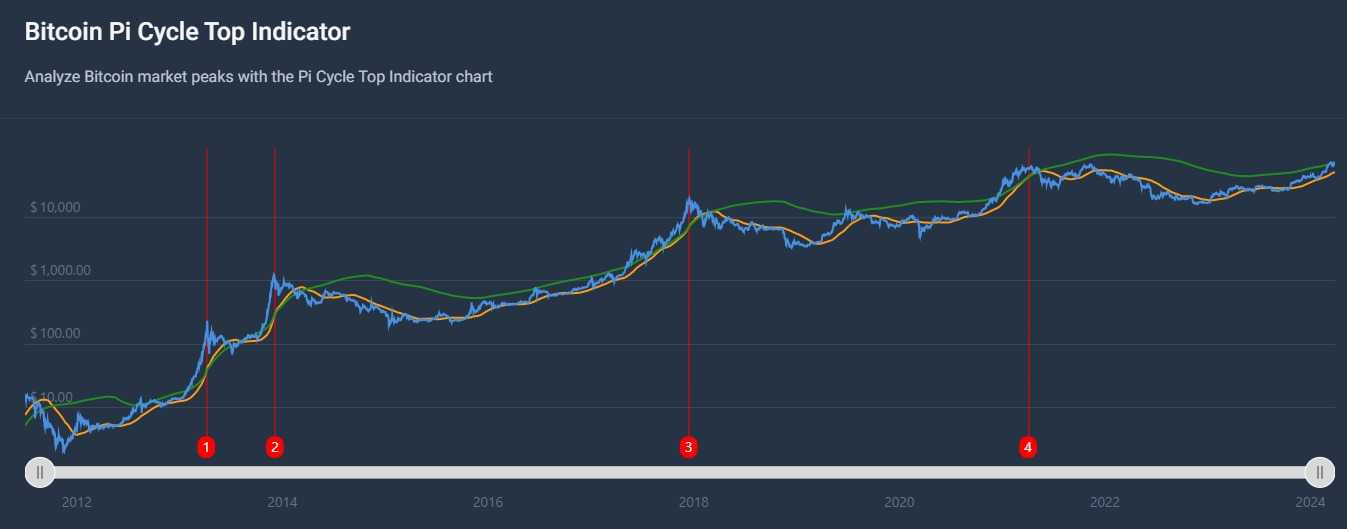
This is ALWAYS the very first chart I post in the MEMBER ONLY "Looking Glass" posts
Pi Cycle Top Indicator-A technical analysis indicator crafted to determine market tops.
The Pi Cycle Top Indicator is a technical analysis tool designed to identify potential Bitcoin market tops, which are periods when the price of Bitcoin might be at its highest point before a significant downturn.
In simple terms, it works by identifying the cross-sections in the shorter and longer-term moving averages. Historically, such crossovers have correlated with peaks in Bitcoin's price with remarkable accuracy.
Here are the cycle top predictions made by the indicator and the actual cycle highs (in the brackets):
📈 Apr 5, 2013; BTC Price: $142 (Apr 9, 2013; BTC Price: $230)
📈 Dec 5, 2013; BTC Price: $1,056 (Nov 30, 2013; BTC Price: $1,156)
📈 Dec 14, 2017; BTC Price: $16,341 (Dec 17, 2017; BTC Price: $19,927)
📈 Apr 3, 2021; BTC Price: $58,931 (Apr 14, 2021; BTC Price: $64,816)
As demonstrated, the Pi Cycle Indicator has an impressive track record in accurately predicting Bitcoin cycle highs, with an average deviation of just 6 days from the actual market tops.
Interested? Want to learn more about the community?
What else you may like…
Videos
Podcasts
Posts
Articles
Be Prepared, NOT 😱 SCARED
If anything happens, Remember what Michelle Whitedove had said, it will only be TEMPORARY and will only last a week or so. 🔮 ✨️
🚨 UK Issues Unprecedented Emergency Preparedness Directives to Citizens! 🇬🇧⚠️
In a blunt call to action on public television, official UK defense and government leadership—including Defence Secretary Wes Streeting and military heads—are warning the public to face the reality of an increasingly unstable global landscape. 📉🔥
⚠️ The "Be Ready" Emergency Checklist for Households:
• 3-Day Water & Non-Perishable Food: Store a minimum of 3 liters of drinking water per person per day, along with tinned food that requires no heating or power. 🥫💧
• Physical Cash Reserves: Keep cash on hand (coins and notes) to navigate potential digital payment, credit card, or banking network blackouts caused by cyberattacks. 💵📵
• Off-Grid Power & Communications: Maintain fully charged power banks, battery-powered flashlights, FM radios, and ...
00:02:02
🚨 ANTHROPIC'S SECURITY CHIEF JUST ISSUED A WARNING. 🚨
"As bad as things have gotten in the past 4 days, they are going to get A LOT worse before they get better."
This week:
→ 2 PHP flaws rated 9.2/10, found using AI
→ PHP runs ~69% of all websites
→ Millions of exploit attempts in a day
→ Banks, hospitals and government sites taken offline
His advice: "hold on for -18 months." 😨
00:00:15
🚨 Chutes is being framed as a Hyperliquid-style breakout for decentralized AI inference, with live revenue, verified GPU infrastructure, and a direct challenge to centralized cloud AI 🚨
Chutes is gaining attention as a decentralized AI inference platform that claims to combine real usage, cryptographic verification, confidential computing, and open-source infrastructure into a working production system. The thesis is simple: instead of trusting Big Tech clouds with AI workloads, users get a distributed compute layer built around verification and privacy.
🔑 Key points
🔹 Chutes is live in production and reportedly scaled to more than 1,170 active GPU nodes, including large numbers of Nvidia H200s and Blackwell-class hardware.
🔹 The platform says it has processed nearly 38 trillion tokens since launch across 53 deployed applications and more than 700,000 registered users.
🔹 The team reportedly cut unprofitable usage programs, reduced total token volume, and still improved revenue efficiency, with revenue per GPU rising sharply after removing subsidized traffic.
🔹 Chutes is using post-quantum cryptography, trusted execution environments, and Nvidia confidential ...
🚨 JPMorgan’s criticism of the CLARITY Act is fueling a fresh power struggle over who gets to write America’s crypto rules 🚨
A new clash is emerging between legacy finance and crypto legislation after JPMorgan CEO Jamie Dimon reportedly warned that the CLARITY Act could let crypto firms offer bank-like products without bank-level oversight. The dispute is quickly turning into a larger fight over regulation, competitiveness, and who controls the future architecture of digital finance in the United States.
🔑 Key points
🔹 Jamie Dimon reportedly called the CLARITY Act a threat to the financial system, arguing it could allow crypto firms to offer yield-like products while avoiding the capital, reserve, and oversight burdens traditional banks face.
🔹 Senator Cynthia Lummis pushed back publicly, framing the issue as a global strategic race and warning that if the U.S. does not set digital asset standards, other powers will.
🔹 The core tension is whether the bill creates legitimate regulatory clarity or simply opens the door to regulatory arbitrage for crypto platforms operating outside the traditional banking...
👉 Coinbase just launched an AI agent for Crypto Trading
Custom AI assistants that print money in your sleep? 🔜
The future of Crypto x AI is about to go crazy.
👉 Here’s what you need to know:
💠 'Based Agent' enables creation of custom AI agents
💠 Users set up personalized agents in < 3 minutes
💠 Equipped w/ crypto wallet and on-chain functions
💠 Capable of completing trades, swaps, and staking
💠 Integrates with Coinbase’s SDK, OpenAI, & Replit
👉 What this means for the future of Crypto:
1. Open Access: Democratized access to advanced trading
2. Automated Txns: Complex trades + streamlined on-chain activity
3. AI Dominance: Est ~80% of crypto 👉txns done by AI agents by 2025
🚨 I personally wouldn't bet against Brian Armstrong and Jesse Pollak.
"The World's Largest Food Plant just EXPLODED in Iowa......"
Explosion + fire at the world’s largest Quaker Oats mill in Cedar Rapids, Iowa. No injuries reported, cause still under investigation. Plant processes 2M+ lbs of oats daily. Video breaks it down + other recent food facility hits.
Source
🚀 The Decentralized G Suite Killer is Here! 🌐⚡
Kaspa ($KAS) and Bittensor ($TAO) have officially joined forces to power Komms—a post-quantum secure, sovereign alternative to Slack, Zoom, and Google Workspace! 🔐💼
Here is why this collaboration is massive:
⚡ Powered by Kaspa & Bittensor: Fast on-chain verification meets heavy off-chain computation.
💸 Massive Cost Savings: Offers enterprise-grade features up to 98% cheaper than traditional centralized platforms.
🛡️ True Data Sovereignty: Zero single points of failure, post-quantum encryption, and full data ownership—no tracking or selling your info!
📈 Ecosystem Fuel: Drives Kaspa node growth & transaction fees, while allocating 25% of top-line revenue to Bittensor alpha token buybacks! 🔄🔥
🎬
#Komms #Bittensor #Kaspa #TAO #KAS #SN27 #DataSovereignty
🌎 Schumann Resonance Today 10/26 🌎
Right now the Schumann resonance fundamental sits at 7.83 Hz, with geomagnetic activity quiet (Kp 0.3).
Gentle Solar Breath, Magnetosphere Unmoved: A C1.5 flare and slow solar wind at 319 km/s leave the magnetosphere essentially undisturbed, with a Kp of 0.3 pointing toward a stable electromagnetic backdrop.


Revolut Leak Shows the Cost of Constant ID Collection


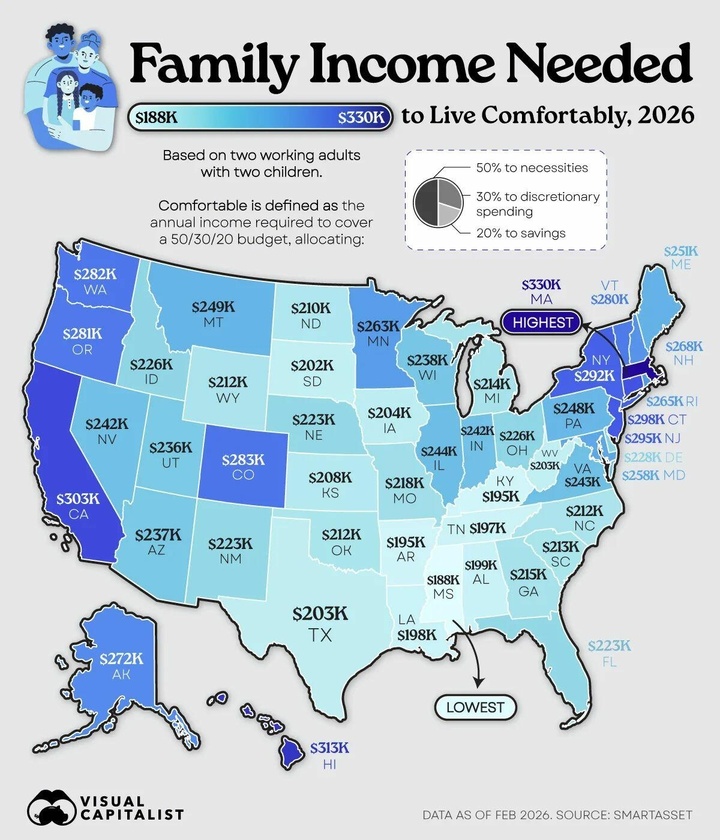
This Is The Income A Family Needs To Live Comfortably In Every US State
Here’s the short version of what it takes for a family of four to live comfortably in 2026 by state:
In Massachusetts, you’d need nearly $330,000 a year - the highest figure in the entire country. Only three states clear the $300,000 mark: Massachusetts, Hawaii, and California. At the other end of the spectrum, Mississippi is the most affordable at about $188,000. That’s a full $142,000 less than what you’d need in Massachusetts.
So… how much does a family of four need in your state?
This map shows the pre-tax income a household with two working adults and two kids needs to live comfortably in every U.S. state.
The numbers come from SmartAsset (as of February 2026). They’re based on the familiar 50/30/20 budget: 50% for necessities, 30% for discretionary spending, and 20% for savings or other goals. These aren’t bare-minimum survival numbers—they’re what it takes to live pretty well while still putting money aside.
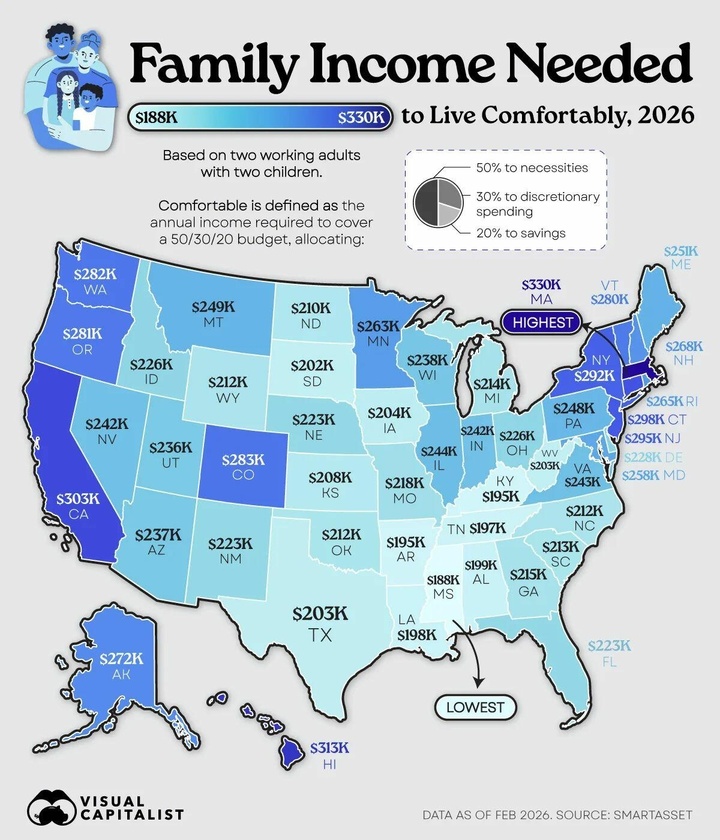
And as Visual Capitalist notes, Massachusetts sits at the very top of that list. Massachusetts tops the ranking, with a family of four needing $329,555 per year to meet the 50/30/20 benchmark.
Hawaii follows at $313,165, while California ranks third at $302,682.
Rank State Income needed for family of four (2026)
- 1 - Massachusetts - $329,555
- 2 - Hawaii - $313,165
- 3 - California - $302,682
- 4 - Connecticut - $298,189
- 5 - New Jersey - $295,110
- 6 - New York - $291,533
- 7 - Colorado - $283,213
- 8 - Washington - $281,798
- 9 - Oregon - $280,966
- 10 - Vermont - $280,384
- 11 - Alaska - $272,064
- 12 - New Hampshire - $267,904
- 13 - Rhode Island - $264,659
- 14 - Minnesota - $263,078
- 15 - Maryland - $257,837
- 16 - Maine - $250,931
- 17 - Montana - $249,434
- 18 - Pennsylvania - $247,936
- 19 - Illinois - $244,109
- 20 - Virginia - $242,944
- 21 - Nevada - $242,278
- 22 - Indiana - $241,696
- 23 - Wisconsin - $238,451
- 24 - Arizona - $236,870
- 25 - Utah - $235,789
- 26 - Delaware - $228,134
- 27 - Ohio - $226,221
- 28 - Idaho - $226,054
- 29 - Florida - $223,392
- 30 - New Mexico - $223,142
- 31 - Nebraska - $223,059
- 32 - Missouri - $217,734
- 33 - Georgia - $214,573
- 34 - Michigan - $214,323
- 35 - South Carolina - $212,909
- 36 - North Carolina - $212,410
- 37 - Wyoming - $212,410
- 38 - Oklahoma - $211,910
- 39 - North Dakota - $210,496
- 40 - Kansas - $207,917
- 41 - Iowa - $204,422
- 42 - Texas - $203,424
- 43 - West Virginia - $202,592
- 44 - South Dakota - $201,760
- 45 - Alabama - $198,931
- 46 - Louisiana - $197,933
- 47 - Tennessee - $197,267
- 48 - Arkansas - $195,437
- 49 - Kentucky - $194,854
- 50 - Mississippi - $187,533
Connecticut, New Jersey, and New York aren't far behind, bringing the number of states with comfortable-income thresholds above $290,000 to six.
Colorado and Vermont Make the Top 10
As expected, many of the highest income thresholds are concentrated in the Northeast and along the West Coast.
However, Colorado has the seventh-highest threshold in the country at $283,213, ranking above Washington and Oregon.
Vermont rounds out the top 10 at $280,384, despite having the second-smallest population of any U.S. state. Meanwhile, nearby states like New Hampshire, Maine, and Rhode Island all fall outside the top 10.
Just Six States Come in Below $200,000
Despite the wide range in living costs across the country, only six states have a comfortable-income threshold below $200,000 for a family of four.
Mississippi ranks lowest at $187,533, followed by Kentucky. The states of Arkansas, Tennessee, Louisiana, and Alabama also fall below the $200,000 mark.
The gap between Massachusetts and Mississippi exceeds $142,000 per year, meaning the Massachusetts benchmark is about 76% higher.

🙏To support my work, Helping to keep the signal high and the noise low:
👉 Cashapp: $thedinarian
👉 Buy me a coffee: https://buymeacoffee.com/thedinarian
👉 PayPal: Scan the QR code below 📲 or Click Here:

👇 Crypto Donations Always Welcome 👇
XRP: r9pid4yrQgs6XSFWhMZ8NkxW3gkydWNyQX
XLM: GDMJF2OCHN3NNNX4T4F6POPBTXK23GTNSNQWUMIVKESTHMQM7XDYAIZT
XDC: xdcc2C02203C4f91375889d7AfADB09E207Edf809A6

🤖Can Decentralized AI Stop Big Tech from Owning the Future of Robotics?🤖
The race to build the future of robotics is no longer just about robots. It's about who controls the intelligence behind them.
Over the last three years, a small group of companies has emerged as the backbone of the AI revolution. Microsoft provides cloud infrastructure. NVIDIA supplies the chips. Google, OpenAI, Anthropic, Meta, and others develop the models. Together, they control much of the compute, data, and software stack powering modern AI.
Now that AI is moving into the physical world, many are asking a bigger question:

Will these same companies end up controlling robotics too?
It's a valid concern.
The latest generation of robots relies on enormous amounts of compute, simulation, training data, and foundation models. Many robotics startups today are built on infrastructure provided by large technology companies. NVIDIA's Omniverse is becoming a key simulation environment for robot training. Microsoft Azure is powering the training of robotics foundation models. Physical AI startups increasingly depend on hyperscale cloud infrastructure to train and deploy intelligent systems. Recent partnerships across the industry show just how central Big Tech has become to robotics development.
But while Big Tech is building the highways, another movement is trying to ensure it doesn't own every destination.
That movement is decentralized AI.
Why Decentralized AI Exists
The idea behind decentralized AI is simple. Instead of a handful of companies owning the models, compute infrastructure, data pipelines, and intelligence networks, these resources are distributed across thousands of participants.
This means anyone can contribute compute, contribute models, validate outputs and can participate.
The most visible example today is the decentralized AI network known as Bittensor (@bittensor). The network has evolved into a large ecosystem of specialized AI markets called subnets, where participants compete to provide useful machine intelligence and are rewarded based on performance. Rather than relying on a single company, intelligence is generated and validated by a distributed network of miners and validators.
Think of it as an attempt to build an open marketplace for AI instead of a world where intelligence is rented from a few centralized providers.
Why This Matters for Robotics
Robotics has a unique problem. Unlike chatbots, robots operate in the physical world. They need to perceive environments, make decisions, move safely and they need to learn continuously.
The challenge is that collecting and training on real-world robotic data is incredibly expensive. That's one reason large companies have such an advantage. They can afford the compute, simulation environments, and data infrastructure needed to train robotics models at scale.
This is where decentralized systems become interesting.
Instead of one company collecting all the data and training all the models, decentralized networks could allow thousands of contributors to participate in building robotic intelligence.
Imagine a future where:
- Warehouse robots contribute operational data.
- Delivery robots contribute navigation data.
- Factory robots contribute manipulation data.
- Developers contribute models.
- Validators evaluate performance.
The resulting intelligence becomes a shared network rather than a proprietary asset.
That vision is beginning to emerge.
Bittensor's Move Toward Physical AI
While many people associate Bittensor (@bittensor) with language models and AI services, parts of the ecosystem are increasingly exploring embodied intelligence and robotics.
One example is Kinitro, a subnet focused on incentivizing the training and evaluation of embodied AI systems. The goal is to create competitive environments where developers build robotic intelligence and are rewarded based on performance.
The broader Bittensor ecosystem has also expanded into compute marketplaces, distributed inference systems, bandwidth infrastructure, and AI coordination layers that could eventually support robotics workloads. Several subnets now focus on decentralized compute, confidential inference, data transfer, and model training, critical components for future robotic systems.
In other words, the pieces are starting to appear.
Not a decentralized robot network yet.
But the infrastructure that could support one.
Beyond Bittensor: The Rise of Physical AI Networks
Bittensor isn't alone.
Across the industry, researchers and builders are experimenting with decentralized approaches to physical AI.
New research published in 2026 introduced the concept of DAO-enabled decentralized physical AI, or DePAI. The idea combines robotics, decentralized infrastructure, AI models, governance systems, and human oversight into a single framework. Instead of centralized control, robots and physical infrastructure could be coordinated through transparent rules and distributed ownership models.
At the same time, developers are exploring decentralized operating systems for robots that allow machines to communicate directly with each other and with distributed compute resources. These architectures are designed to make robotic systems more resilient and less dependent on a single cloud provider.
The goal is not simply decentralization for its own sake.
The goal is resilience.
If one server fails, the system continues.
If one company disappears, the network survives.
If one participant leaves, innovation continues.
But Here's the Reality
Decentralized AI faces the same challenge every decentralized technology faces.
Big Tech has resources. A lot of resources.
Training advanced robotics models requires enormous compute budgets, sophisticated simulation environments, access to specialized hardware, and vast amounts of real-world data.
That's why many robotics startups still partner with major cloud providers and AI companies. It's often the fastest path to deployment.
And there are legitimate concerns about whether decentralized networks can maintain quality, reliability, and security at the scale required for industrial robotics. Even researchers studying decentralized AI systems have highlighted risks around concentration, incentives, governance, and network security.
The challenge isn't just decentralizing intelligence.
It's decentralizing intelligence while maintaining performance.
That's much harder.
The Most Likely Outcome
The future probably won't be fully centralized. And it probably won't be fully decentralized either. Instead, we're likely heading toward a hybrid model.
Large technology companies will continue providing chips, cloud infrastructure, simulation platforms, and foundational research.
At the same time, decentralized AI networks will emerge as alternative coordination layers where intelligence, data, and economic value can be shared more openly.
The companies building robots may use NVIDIA hardware.
Train on Azure.
Run foundation models from OpenAI.
But they may also participate in decentralized data networks, decentralized compute markets, and decentralized intelligence protocols.
The future of robotics could end up looking less like a monopoly and more like an ecosystem.
The Bigger Question
The real question isn't whether decentralized AI can eliminate Big Tech.
It can't.
At least not anytime soon.
The real question is whether decentralized AI can prevent a future where a handful of companies control every robot, every model, every dataset, and every decision made by the machines operating around us.
As robots become workers, assistants, delivery drivers, factory operators, and even economic agents, that question becomes increasingly important.
Because the battle for the future of robotics is no longer about hardware.
It's about who owns the intelligence.
And that battle is just getting started.

🙏To support my work, Helping to keep the signal high and the noise low:
👉 Cashapp: $thedinarian
👉 Buy me a coffee: https://buymeacoffee.com/thedinarian
👉 PayPal: Scan the QR code below 📲 or Click Here:

👇 Crypto Donations 👇
XRP: r9pid4yrQgs6XSFWhMZ8NkxW3gkydWNyQX
XLM: GDMJF2OCHN3NNNX4T4F6POPBTXK23GTNSNQWUMIVKESTHMQM7XDYAIZT
XDC: xdcc2C02203C4f91375889d7AfADB09E207Edf809A6