As Peter Lynch once famously said: “Far more money has been lost by investors preparing for corrections, or trying to anticipate corrections, than has been lost in corrections themselves.”
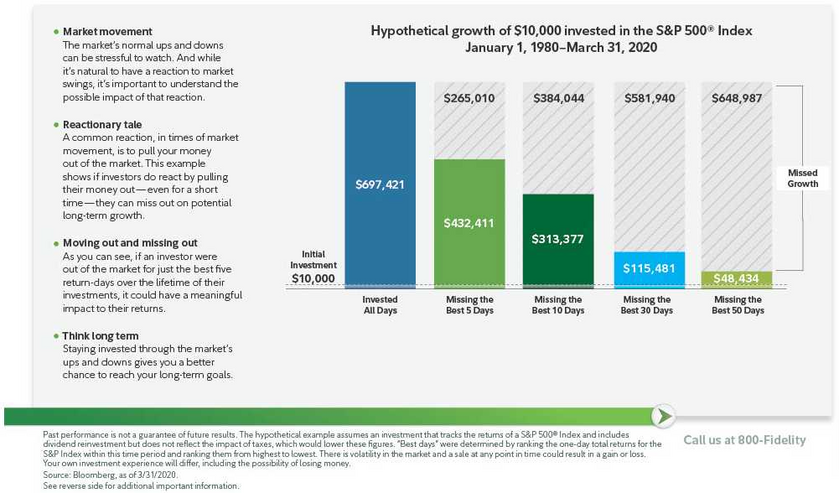
If an investor missed the best 5 days in the market, dating from 1980-2020, they would have missed out on a total return of 40%. That’s 1% per year over 40 years. If one missed the best 10 days, then the return was cut in half. See this chart below.
Next, let’s look at a chart below of the overall U.S. stock market return each year for the last 50 years. I created this chart which displays the years that stocks were down 0-10% in red text, down 10-20% in light red fill, and down more than 20% in dark red fill with white text. I’ve included light green fill for positive years but that were below the average of 10% (i.e. 0-10%). The bold green text represent the years where the markets returned above the average of 10%.
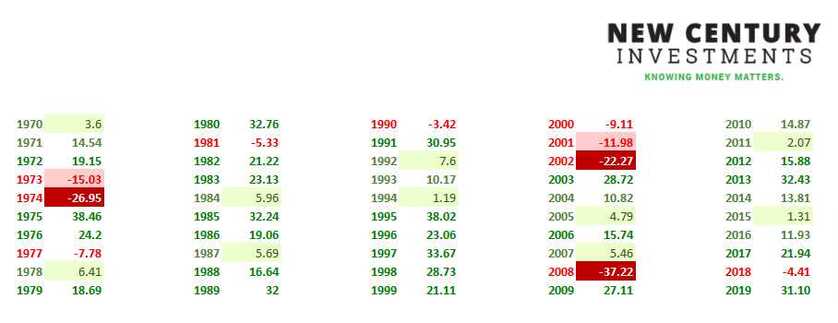
Not included is 2020-2021, which despite the COVID drop-down, ended in the dark green for 2020 and 2021, well above the average of 10%. In 2020 a record number of investors began selling stocks in March, shifting to cash until things cleared up. Now many are still waiting on the sidelines for their next entry point. While it may be tempting to shift entirely to cash, that is usually not an advisable decision. Take a look at the chart above. It can feel challenging or even exhausting to endure a 1973-1974, 2000-2002, or a 2008-2009 stock market crash. Despite this, however, notice how much more green is on the chart above. Shifting an entire portfolio to cash presents another decision of when to re-enter back into the market. This introduces the possibility of human error, an added risk to the portfolio. By sticking with your long-term investment plan,📊 depending on your time horizon and preferred risk level, continually investing, dollar-cost averaging and maintaining, despite a market correction, 👉you will prosper! 🤑